Path to Conversion
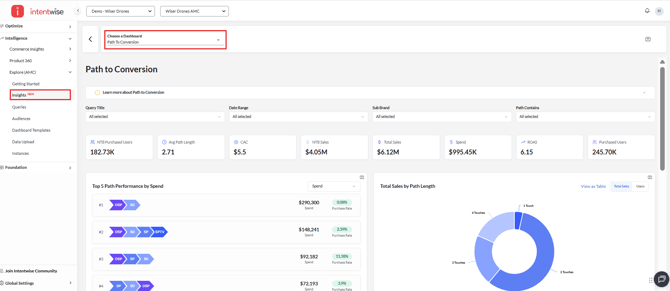
The Path to Conversion dashboard helps you understand how different ad touchpoints contribute to conversions. It highlights the journeys customers take before making a purchase, showing you which sequences of ads drive the most sales and efficiency.
This dashboard provides a complete view of user paths, spend allocation, and conversion outcomes so you can refine your cross-channel strategy.
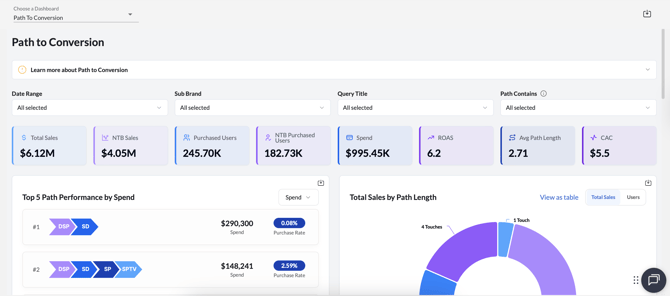
Dashboard Overview
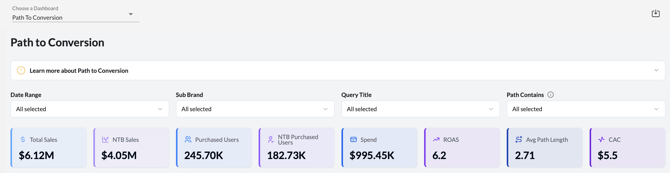
At the top, you’ll see key performance metrics:
-
Total Sales – Overall revenue generated.
-
NTB Sales – Revenue from new-to-brand customers.
-
Purchased Users – Unique users who made a purchase.
-
NTB Purchased Users – Unique new-to-brand customers acquired.
-
Spend – Total advertising spend across campaigns.
-
ROAS – Return on ad spend.
-
Avg Path Length – Average number of touchpoints before a conversion.
-
CAC – Customer acquisition cost.
This overview gives you a quick read on efficiency and the role of multi-touch journeys.
Top 5 Path Performance by Spend
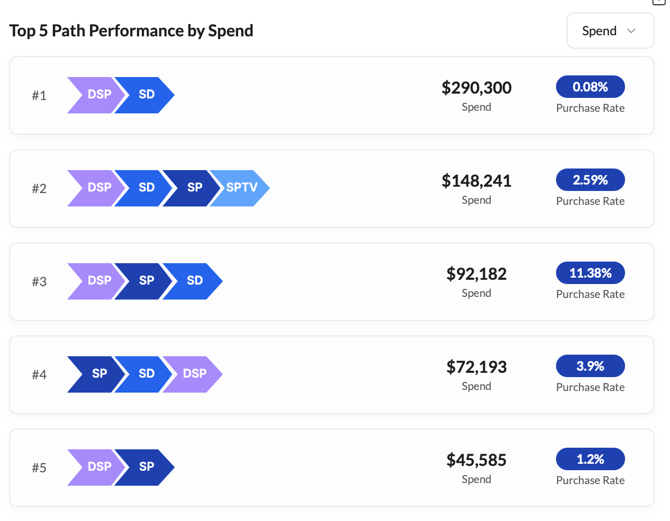
This section shows the ad paths with the highest spend, along with their purchase rates.
For example:
-
DSP → SD drove $290K in spend but had a low purchase rate of 0.08%.
-
DSP → SD → SP → SPTV spent $148K with a purchase rate of 2.59%.
You can use this view to evaluate whether your biggest investments are yielding efficient conversions or need optimization.
Total Sales by Path Length
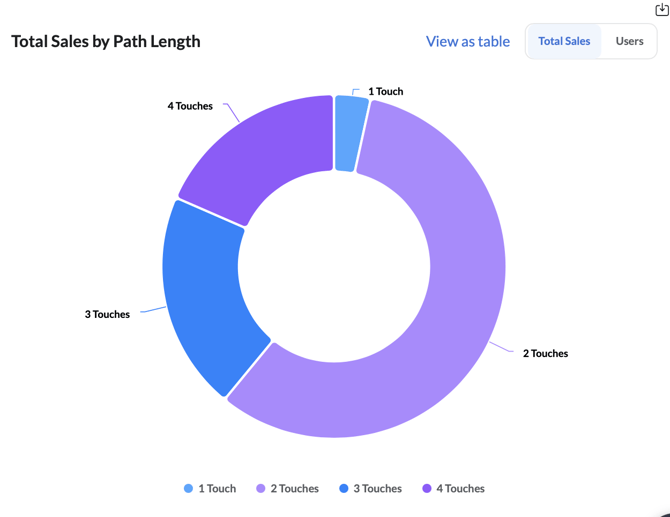
This visualization groups sales by the number of ad touches:
-
1 Touch – Single exposure before purchase.
-
2 Touches – Two ad exposures before purchase.
-
3 Touches & 4 Touches – Longer paths before conversion.
For example, many sales occur after 2 touches, showing the importance of sequencing ads rather than relying on single impressions.
First Touch – Last Touch Path Analysis
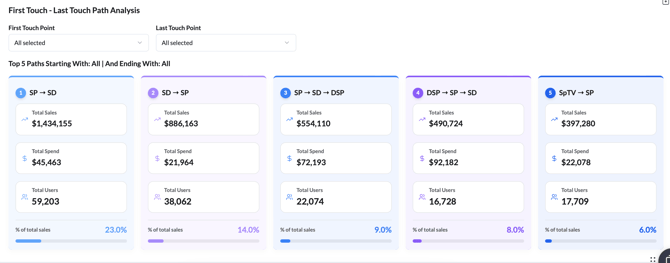
This section isolates the beginning and end points of user journeys, helping you see which entry ads and final ads influence conversions most.
For example:
-
SP → SD generated $1.43M in sales from 59K users at just $45K spend.
-
SD → SP drove $886K in sales with a $22K spend.
-
DSP → SP → SD produced $490K in sales across 16K users.
This view helps you understand which ads are best for introducing customers to your brand versus closing the purchase.
Performance by Path
The Performance by Path table gives a detailed breakdown of each path, including:
-
Path occurrences
-
NTB Sales and NTB %
-
Total Sales
-
Purchased Users and NTB Purchased Users
-
Spend
-
CAC
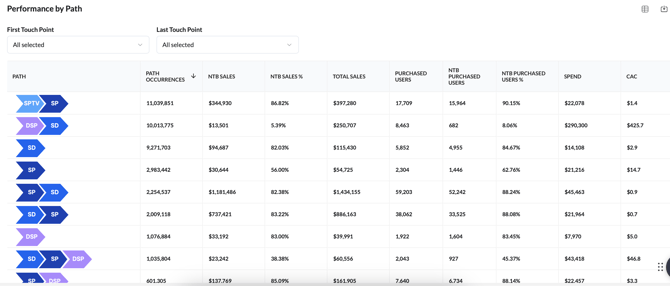
For example:
-
SPTV → SP generated $397K in sales, with 90% coming from NTB customers.
-
SD → SP → DSP produced $60K in sales at a CAC of $46.8.
-
SP → SD → DSP yielded $886K in sales with a strong NTB share of 88%.
This table is ideal for pinpointing which sequences deliver high NTB efficiency and which may be overspending relative to return.
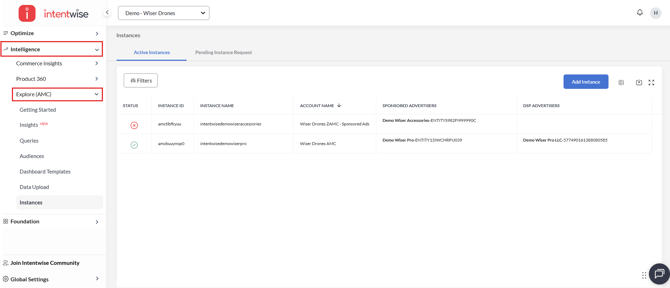
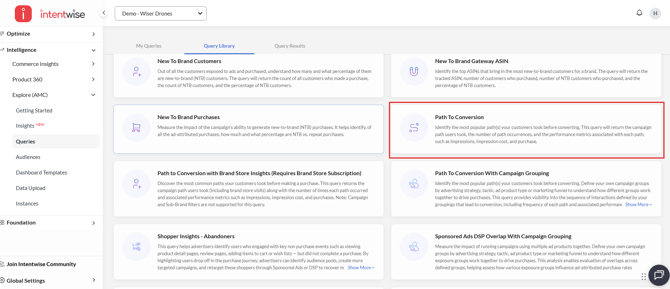
How it works
-
Navigate to Intelligence -> Explore(AMC)
-
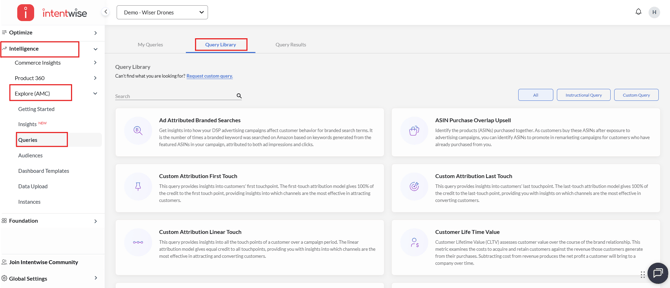
Go to Queries > Query Library
-
Search for and add "Path to Conversion" to your saved queries
-
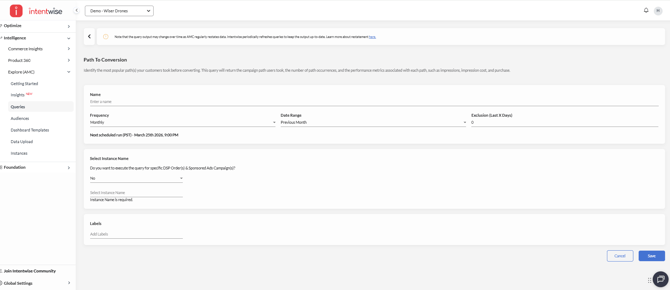
Fill in the required parameters and run the query (refer to this article for detailed settings)
-
Once executed, access the results under the Insights section for product-level metrics and visualizations.
For more information, refer to our data model.
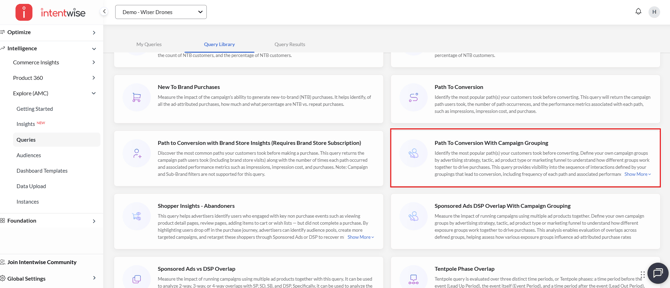
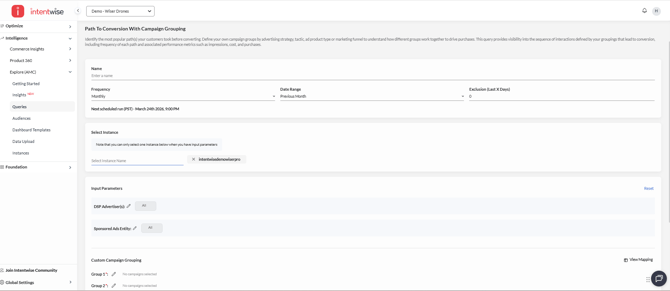
Path To Conversion With Campaign Grouping
Understand the most common paths your customers take before making a purchase. With custom campaign grouping, you can organize campaigns based on strategy, tactics, ad product type, or marketing funnel stage to analyze how different groups work together to drive conversions.
This query provides visibility into the sequence of interactions defined by your campaign groupings, along with key performance metrics such as impressions, cost, and purchases. It also highlights the frequency of each conversion path, helping you identify the most effective customer journeys.
How it works
-
Navigate to Intelligence -> Explore(AMC)
-
Go to Queries > Query Library
-
Search for and add "Path to Conversion with Campaign Grouping" to your saved queries
-
Fill in the required parameters (refer to this article for detailed guidance)
Note: You can only select one instance per query setting
-
Campaign Group Configuration
-
You can define up to 5 custom campaign groups
-
A minimum of 2 groups is required, while the remaining are optional
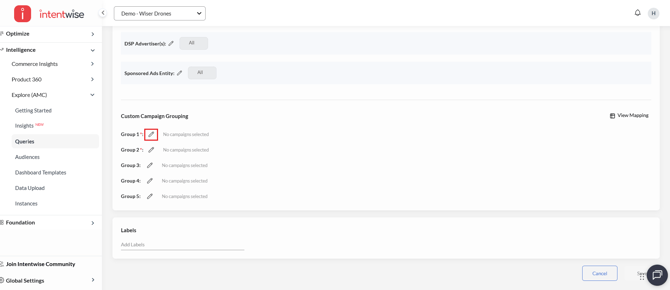
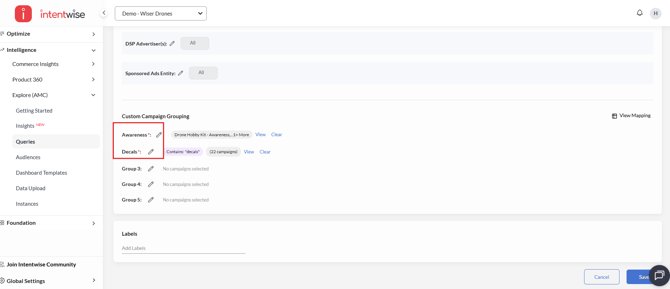
- Campaign groups can be renamed to align with your naming conventions for better clarity and organization
-
-
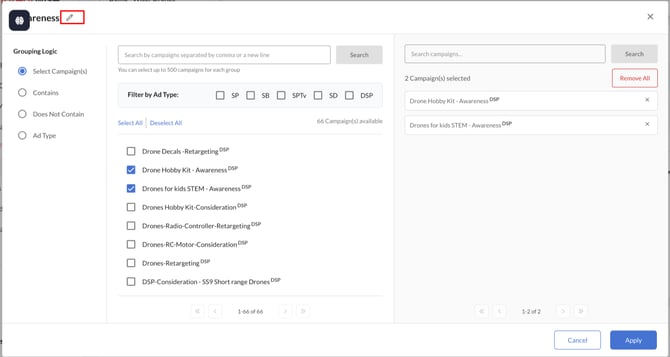
Grouping Options
You can define campaign groups using one of the following methods:
-
Select Campaign (Static)
Choose specific campaigns using filter conditions. The selected campaigns remain fixed and do not change over time. This method allows you to select up to 500 campaigns.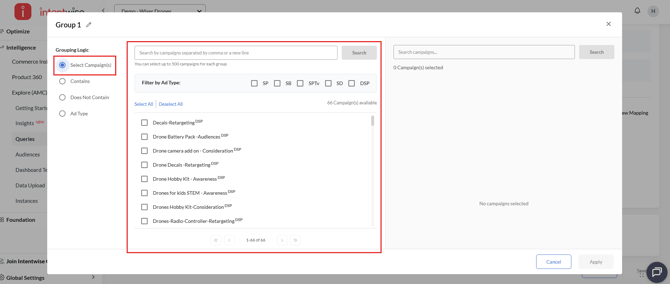
-
Contains (Dynamic)
Enter one or more strings (each on a new line) to match campaign names containing those values.
Multiple entries are treated as OR conditions (e.g., string1 OR string2).
Campaigns are dynamically identified at runtime, so newly created campaigns matching the criteria will be included automatically.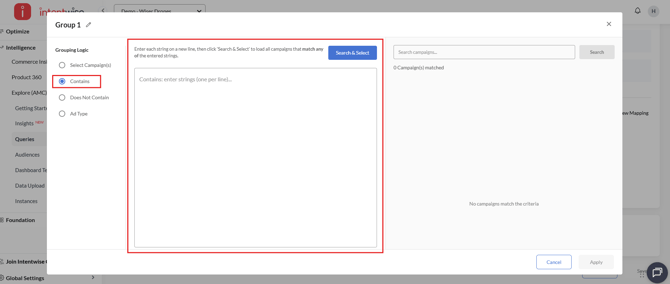
-
Does Not Contain (Dynamic)
Define strings to exclude campaigns containing those values.
Campaigns are dynamically evaluated when the query runs, ensuring new campaigns are included if they meet the criteria.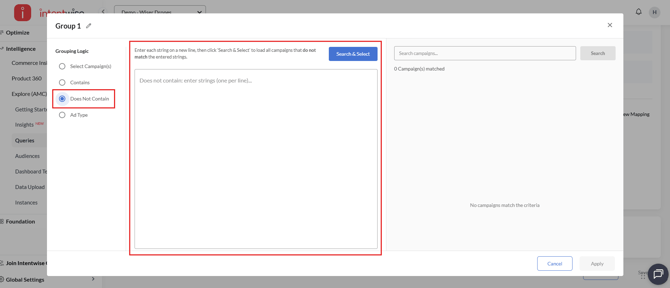
-
Ad Type (Dynamic)
Select one or more ad types. Campaigns are dynamically included based on the selected ad types during query execution.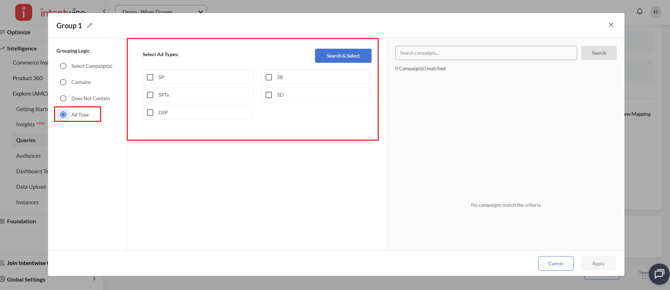
-
- Once all required parameters are configured and the query is executed, results can be accessed in the Insights section within the same Path to Conversion dashboard.
Key Use Cases
-
Measure sequencing effectiveness – See how exposure to different ad types (DSP, SP, SD, SPTV) impacts conversion probability.
-
Optimize budget allocation – Identify which paths generate the highest ROAS and lowest CAC.
-
Evaluate NTB acquisition efficiency – Understand how multi-touch journeys impact new-to-brand growth.
-
Inform creative strategy – Align creatives across channels based on where they appear in the path (upper funnel vs. last touch).
Recommendations
-
Use first-touch vs. last-touch paths to separate prospecting strategies (DSP, SPTV) from conversion-focused ads (SP, SD).
-
Monitor CAC and NTB share closely — scale the paths that bring in new-to-brand customers most efficiently.
-
Reconsider paths with high spend but low purchase rates, as they may indicate wasted impressions.
-
Leverage 2–3 touch sequences as they often strike the best balance between conversion likelihood and cost.
Frequently Asked Questions (FAQs)
What are instructional queries?
Amazon Marketing Cloud's (AMC) instructional queries provide pre-written SQL code that AMC users can use as is or modify for common measurement and analytics tasks.