The Performance Audits feature under Insights helps you evaluate your account’s performance instantly. Within minutes, you can run an audit across campaigns to uncover optimization opportunities, compare spend and revenue distribution, and identify missed targeting or budget gaps. 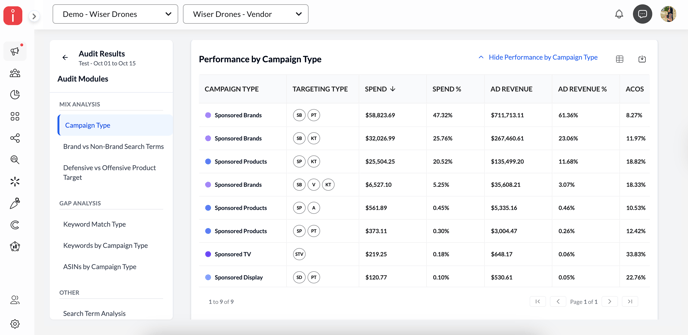
Navigation
-
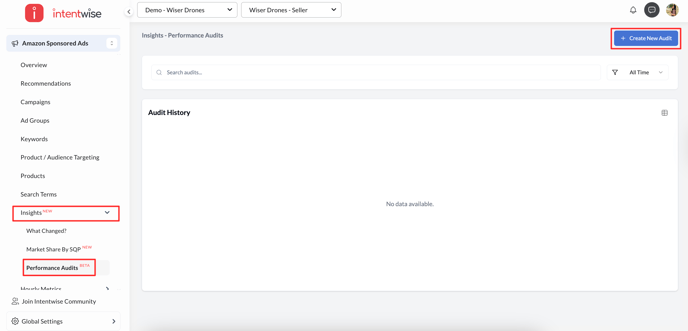
Go to Amazon Sponsored Ads in the left-hand navigation panel.
-
Click on Insights → Performance Audits.
-
Click + Create New Audit on the top-right corner of the screen.
Audit Setup
The audit setup allows you to configure your audit parameters before running it.
1. Audit Configuration
-
Audit Name (Optional): Add a custom name to identify your audit later.
-
Date Range: Choose a time range for your audit analysis. You can choose from various options like last 7 days, 14 days, 30 days, current month, previous month, and more.
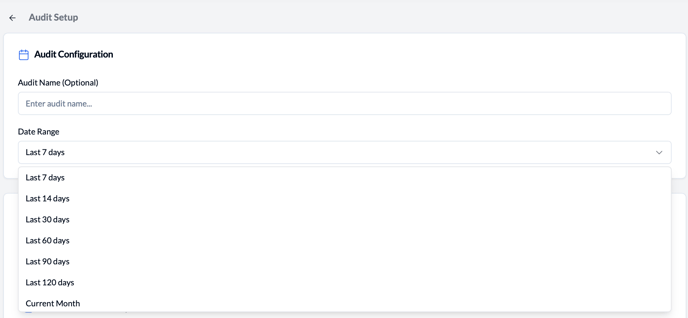
Tip: Choose a longer range (e.g., last 30 or 60 days) for trend analysis, or a shorter one (7 or 14 days) for weekly optimization.
2. Select Audit Modules
Performance Audits includes several prebuilt modules grouped under Mix Analysis, Gap Analysis, and Other. You can select which areas you want to audit, depending on your goal.
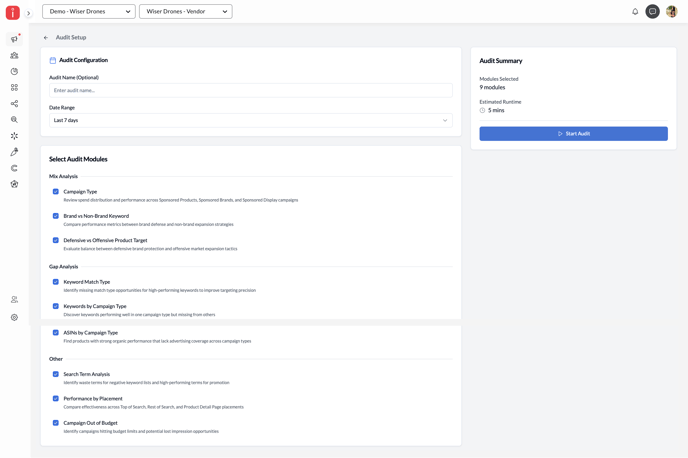
Once selected, the right-hand panel displays the modules selected and estimated runtime (usually under 5 minutes). Click Start Audit to begin.
Note: You’ll receive an in-app and email notification once the audit completes.
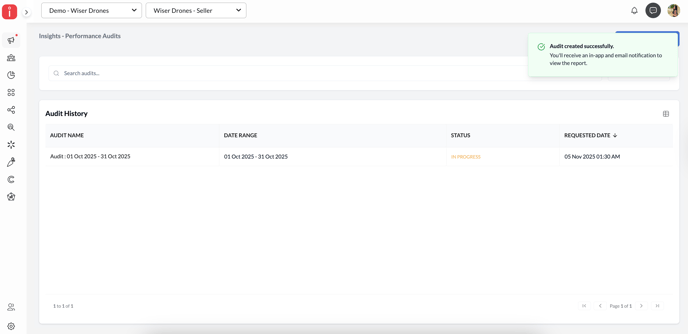
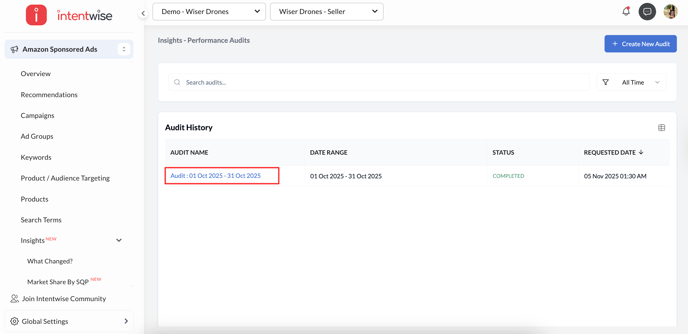
Audit History
After you run an audit, it appears in the audit history section along with the audit name, date range, status (in progress / completed), and requested date. Once complete, click on any audit to view the detailed results.
Understanding Mix Analysis
The Mix Analysis section provides a high-level performance overview across different campaign strategies and structures. It helps you understand where your spend, ad revenue, and efficiency metrics are concentrated and where adjustments could yield better results.
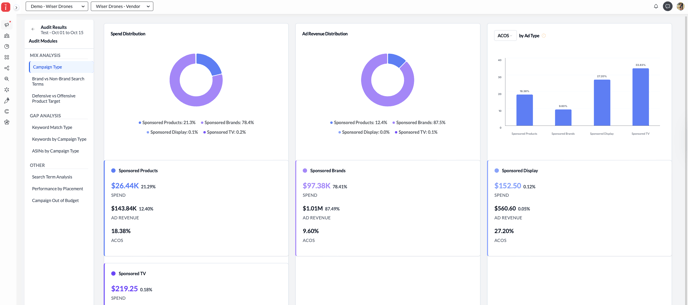
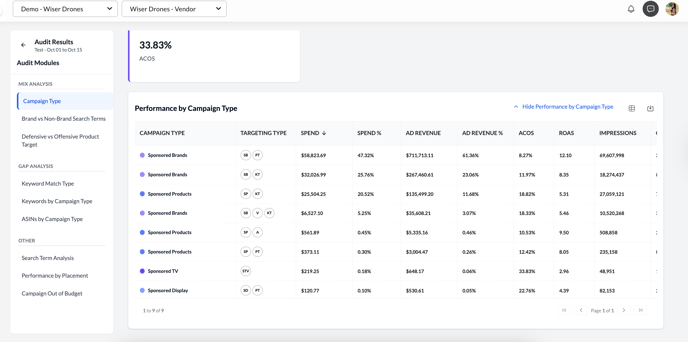
1. Campaign Type Analysis
This module compares spend, ad revenue, and efficiency (ACOS/ROAS) across available campaign types like Sponsored Products, Sponsored Brands, Sponsored Display, and Sponsored TV. You’ll see:
-
Spend Distribution (how your ad spend is split across campaign types)
-
Ad Revenue Distribution
-
ACOS by Ad Type
-
Performance Table showing Spend %, Ad Revenue %, ACOS, ROAS, Impressions, and Clicks per campaign type.
Things to watch out for:
- If you notice that certain campaign types are missing or underrepresented, it may indicate room to expand your structure and capture additional reach through those formats.
- A significant skew in spend (such as higher investment in auto campaigns over manual ones) could suggest opportunities to improve targeting precision and cost control.
- In cases where a campaign type shows unusually high ACOS, it’s worth investigating targeting relevance, bid levels, and placement strategy to improve efficiency.
Tip: A balanced distribution ensures you’re leveraging each campaign type effectively. For example, heavy Sponsored Brand spend with low Sponsored Product visibility may indicate missed conversion opportunities.
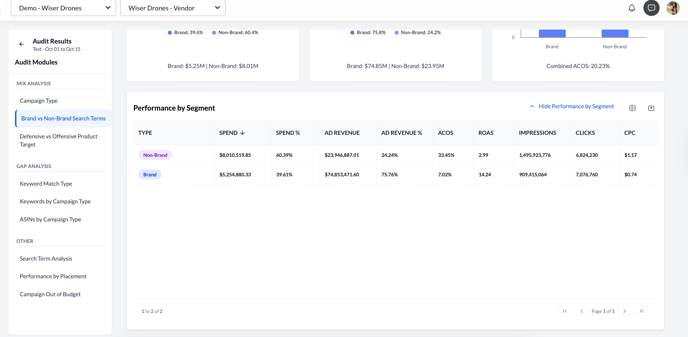
2. Brand vs. Non-Brand Keyword Analysis
This compares your brand and non-brand keyword performance to identify where your growth opportunities lie. It helps you understand whether your strategy leans more toward brand protection (defending branded traffic) or growth (acquiring new shoppers). You’ll see:
-
Spend Distribution between brand and non-brand keywords.
-
Ad Revenue Distribution across those segments.
-
ACOS Comparison bar chart (e.g., Brand ACOS vs. Non-Brand ACOS).
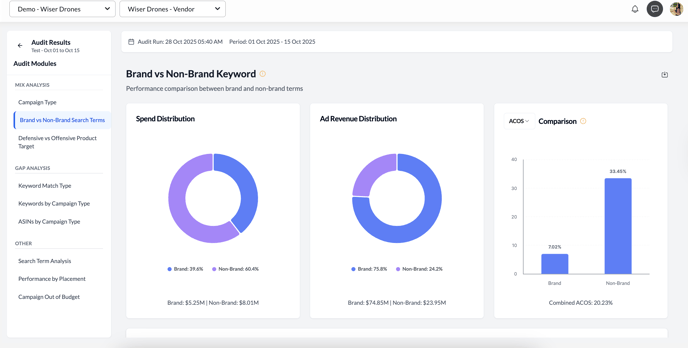
If brand campaigns show much lower ACOS but dominate spend, consider reallocating some budget toward non-brand keywords to expand reach. A high ACOS for non-brand keywords may still be acceptable if they’re driving new-to-brand traffic.
What to Review:
- If your brand terms aren’t actively being used in Sponsored Products or Sponsored Brand campaigns, consider exploring opportunities to strengthen your visibility on branded searches.
- On the other hand, if the majority of spend is concentrated on brand terms, you might explore allocating a portion toward non-brand keywords to reach new audiences and expand market share.
Tip: Maintaining a healthy balance between brand and non-brand keywords helps protect your brand while continuing to drive incremental reach.
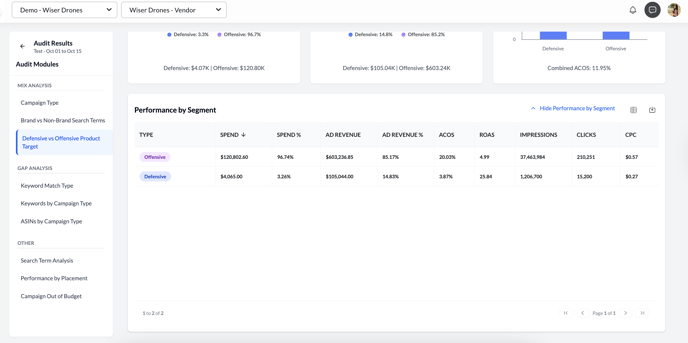
3. Defensive vs. Offensive Product Target Analysis
This module evaluates how balanced your defensive (protecting existing ASINs) and offensive (expansion-focused) targeting strategies are. You’ll see:
-
Spend Distribution: Split between Defensive and Offensive campaigns.
-
Ad Revenue Distribution: Contribution to overall revenue from each.
-
ACOS Comparison: Visual breakdown of efficiency across both strategies.
-
Performance by Segment Table: Includes Spend, Ad Revenue, ACOS, ROAS, Impressions, Clicks, and CPC.
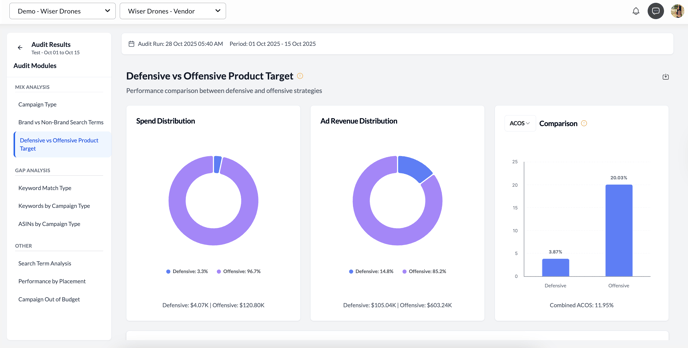
This view compares defensive and offensive strategies, essentially, how much spend is directed toward protecting your own ASINs versus targeting competitor or complementary products.
What to monitor:
- A heavier defensive focus can be useful for brand protection, but too much of it might limit reach and exposure to new shoppers. Conversely, purely offensive strategies may drive broader visibility but can also carry higher ACOS if not monitored carefully.
- If one side dominates, consider reviewing your targeting mix to ensure your campaigns support both brand protection and expansion goals.
Tip: Use this analysis to spot whether your targeting approach is too narrow or too spread out; balance is key to sustainable performance.
Understanding Gap Analysis
1. Keyword Match Type
This view highlights keywords missing match type variations (e.g., a keyword active as Phrase but missing in Exact or Broad). It helps advertisers identify coverage gaps that may limit traffic reach or control. You'll see:
-
The number of total matches missing, meaning 203 keywords (in this example) don’t exist across all three match types.
-
Ad revenue from current match types ($315.23K in this example)
-
Some keywords can move from Broad → Exact (precision opportunity).
-
Some keywords can move from Phrase → Exact (refinement opportunity).
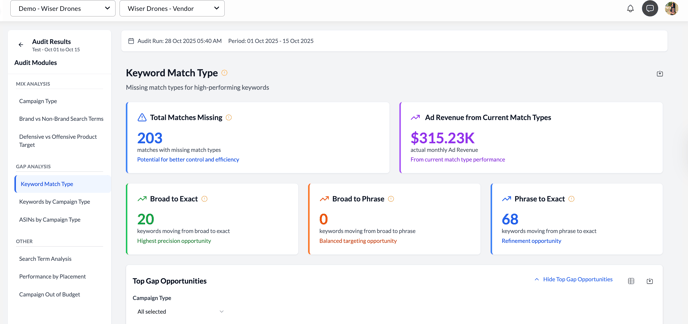
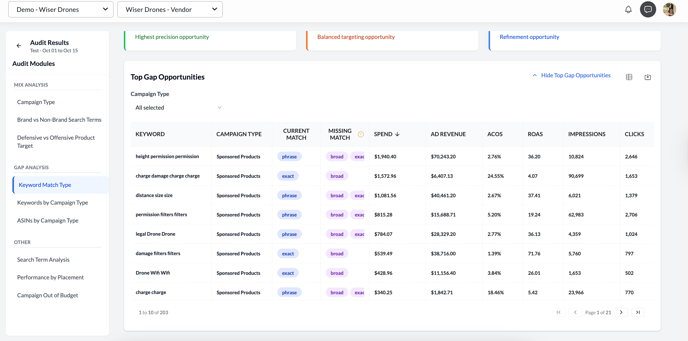
The Top Gap Opportunities table lists each keyword, its current match, missing match types, and performance metrics, helping prioritize which gaps could deliver the most impact.
For example, if you have a high-performing keyword like “distance size size” active in Phrase but not in Exact, the system identifies it as a “missing match.” Adding it in Exact match could help refine targeting and reduce irrelevant clicks.
Tip: Keywords with strong ad revenue but missing tighter match types often represent easy wins for improved efficiency.
-
The number of total matches missing shows how many keywords (in this example) don’t exist across all three match types.
-
The current match types are driving measurable ad revenue, but adding missing match types can help improve reach or control. Focus on high-revenue keywords missing in tighter match types; expanding them can improve precision and cost control.
- If you see a large number of keywords missing tighter match types (e.g., many Broad but few Exact) → consider systematically promoting high-performing keywords from Broad → Phrase → Exact. Broad helps with discovery, Exact gives more control.
-
Others can move from Phrase → Exact (a refinement opportunity). Consider maintaining a discovery-to-precision flow; using Broad for testing, Phrase for mid-funnel targeting, and Exact for high-intent capture.
-
Monitoring this helps ensure that your best-performing terms are represented across the match types that make sense for their intent. Regularly revisit match type mix at least monthly, since shifts in search behavior or seasonality can affect ideal allocation
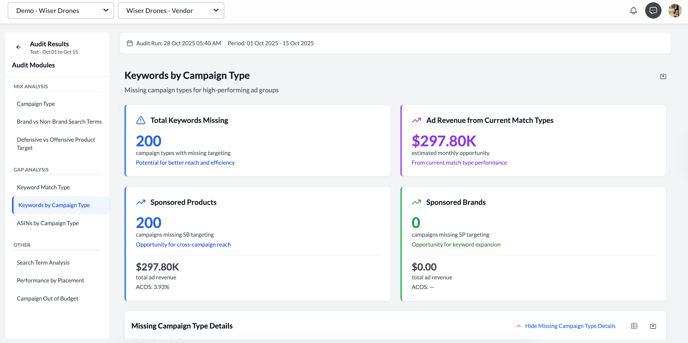
2. Keywords by Campaign Type
This module identifies high-performing keywords that are active in one campaign type but missing in another (for example, active in Sponsored Products but not in Sponsored Brands). You'll see:
-
Total keywords missing across campaign types.
-
Keywords active in Sponsored Products but missing in Sponsored Brands.
-
Ad revenue from current match types.
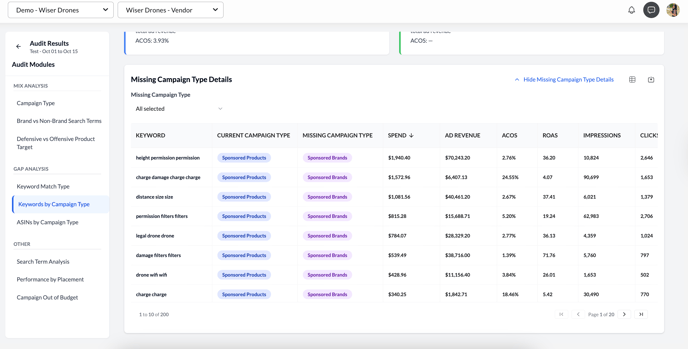
- Performance Table showing keyword, current campaign type, missing campaign type, Spend, Ad Revenue, ACOS, ROAS, and more.
The Missing Campaign Type Details section lists keyword-level data, helping you decide which terms are strong candidates for cross-campaign replication. In this example, some keywords appear in Sponsored Products but not in Sponsored Brands, a possible opportunity to expand visibility. For example, if “charge damage charge charge” is performing well in Sponsored Products but isn’t targeted under Sponsored Brands, you may be missing visibility at the top of the funnel.
Tip: Expanding top-performing SP keywords into SB campaigns can improve visibility and drive additional incremental sales.
-
If strong performers are limited to one campaign type (e.g., active in Sponsored Products but missing in Sponsored Brands), test cross-campaign expansion for incremental reach.
-
Evaluate performance differences. Sponsored Products often drive conversions, while Sponsored Brands help with awareness. Ensure keyword strategy aligns with each campaign’s goal: upper funnel (SB) vs. lower funnel (SP).
-
Evaluate creative and targeting differences between campaign types before replicating keywords to maintain relevance.
-
Use these insights to rebalance budgets or refresh keyword portfolios across campaign types.
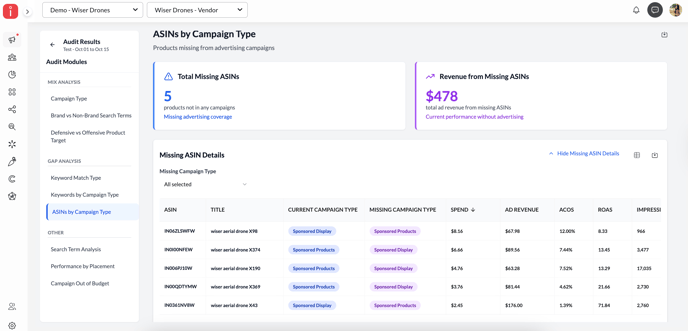
3. ASINs by Campaign Type
This view shows products that are active in one ad type but not in others, revealing potential coverage gaps. You'll see:
-
Number of ASINs missing from certain campaign types.
-
Revenue from missing ASINs. In this example, together, these ASINs already generate $478 in ad revenue without advertising coverage.
- Performance Table showing ASINs, campaign type, missing campaign type, Spend, Ad Revenue, ACOS, ROAS, and more.
A product generating organic revenue without being advertised might benefit from inclusion in Sponsored Products or Display campaigns for added visibility. For example, IN06ZLSWFW (drone X98) appears in Sponsored Display but not in Sponsored Products.
Tip: Ensuring your top-selling ASINs have coverage across multiple campaign types can prevent missed opportunities in discovery and retargeting.
Things to watch out for:
- If key ASINs generate sales without ad support, consider extending them into Sponsored Products or Display campaigns for additional reach.
-
Ensure top-selling and new-to-brand ASINs have visibility across ad types to capture audiences at multiple touchpoints.
-
Use smaller test budgets to assess performance before scaling coverage. Focus first on best-performing ASINs.
-
Monitor overlap to avoid redundancy (e.g., same ASIN targeted too broadly across formats)
Understanding Other Analysis
1. Search Term Analysis
This module separates Low Performer Terms (potential negatives) and Opportunity Terms (strong performers to promote). It helps streamline search term optimization. You'll see:
-
Low-performing terms that represent a potential saving opportunity.
-
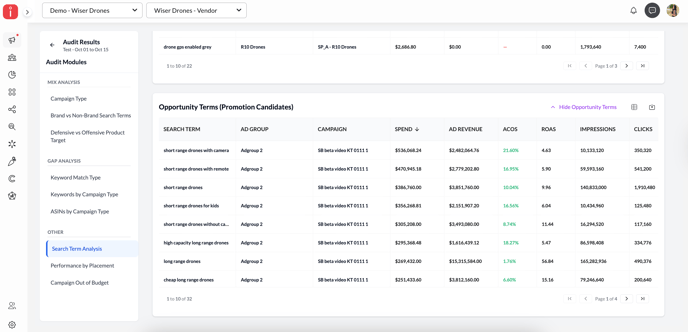
Opportunity terms currently driving ad revenue; these can be moved into exact match campaigns for better control.
Low-performing terms, like “drone camera” (ACOS 115.7%) or “ghost drone with camera” (ACOS 85%), can be candidates for exclusion.
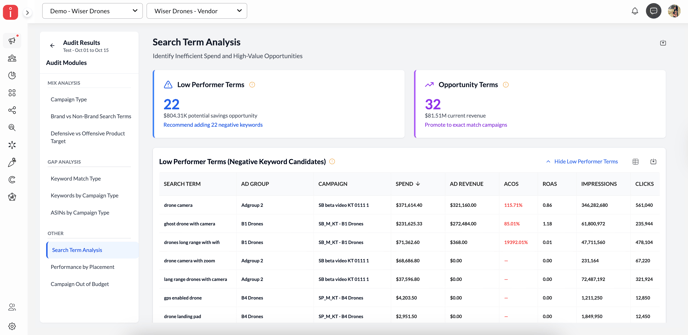
High-performing ones, such as “short range drones with camera” (ACOS 21.6%), can be promoted or scaled.
Tip: Regularly reviewing this report ensures your campaigns focus spend on what converts and eliminate inefficiencies faster.
-
Add low-performing terms as negatives to reduce wasted spend and improve efficiency.
-
Promote strong-performing search terms into Exact match campaigns for better budget control.
-
Check spend-to-revenue ratios; terms with high ACOS but low conversion often signal poor relevance.
-
Reviewing this data regularly ensures campaigns stay efficient and relevant to shopper intent.
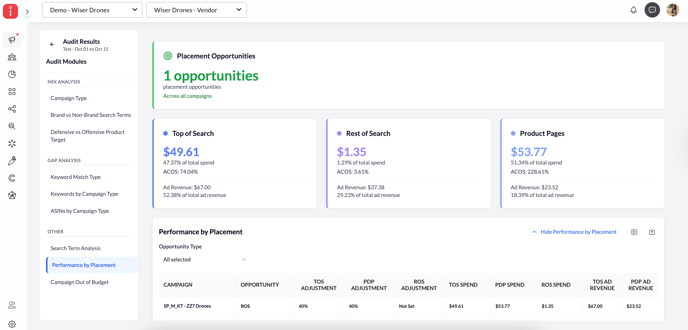
2. Performance by Placement
This view helps identify where your ad spend performs best across placements — Top of Search, Rest of Search, and Product Pages. You'll see:
-
Placement opportunities for Top of Search, Rest of Search, and Product Pages
- Performance Table showing opportunity, various adjustments, and their respective performance metrics like Spend, Ad Revenue, ACOS, and ROAS.
You may want to revisit bid adjustments to favor placements that offer better returns. In this example, you could be allocating more budget toward Rest of Search (ACOS 3.6%).
Tip: Use placement-level insights to rebalance bids — small percentage changes can have a notable impact on overall ROAS.
Things to monitor:
-
If Top of Search shows strong conversion but high ACOS, consider bid adjustments rather than blanket increases.
-
When Product Page placements dominate spend but underperform, test smaller placement multipliers.
-
Identify where ad revenue contribution outweighs spend share—those are placements worth incremental investment.
-
Revisit placement reports after major bid or budget changes to confirm optimization impact.
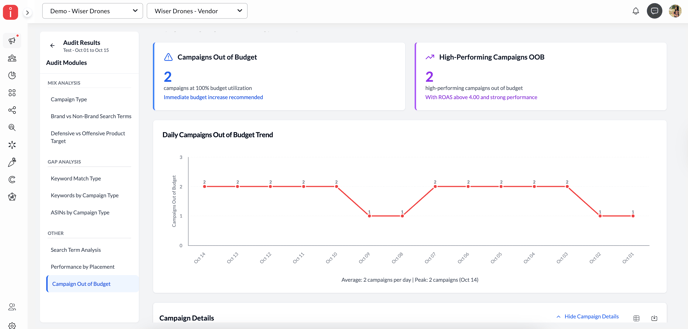
3. Campaigns Out of Budget
This identifies campaigns that frequently hit daily budget limits, risking lost visibility. You'll see:
-
Number of campaigns and high-performing campaignsrunning out of budget
- Daily campaigns out of budget trend
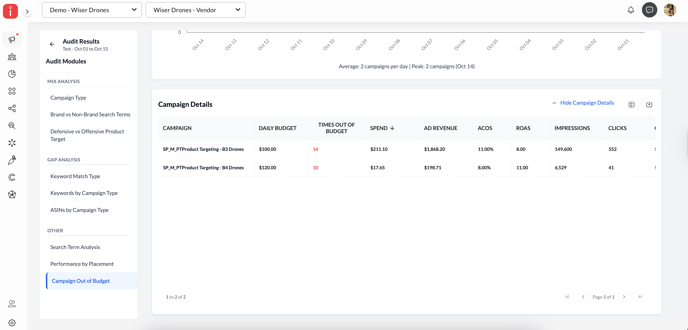
- Performance Table showing daily budget, times out of budget, Spend %, Ad Revenue %, ACOS, ROAS, Impressions, and Clicks per campaign.
Campaigns with consistent out-of-budget trends and strong ROAS might benefit from incremental budget increases to sustain performance throughout the day
In this example, one campaign, SP_M_PT Product Targeting – B3 Drones, reached its cap 14 times but still drove $1,868 in ad revenue with 11% ACOS.
Tip: Use this module to identify where increased budgets can directly translate into incremental revenue.
-
If out-of-budget campaigns show healthy ROAS, incremental budget increases may sustain momentum.
-
Prioritize campaigns that hit budget caps consistently over multiple days (as shown in daily trend).
-
Track recurring patterns; campaigns going out of budget multiple times in a short window may have scalable potential. Reallocate spend from underperforming campaigns before simply increasing overall budgets.
-
Use this as a leading indicator for growth readiness — frequent budget exhaustion often correlates with scalable performance.