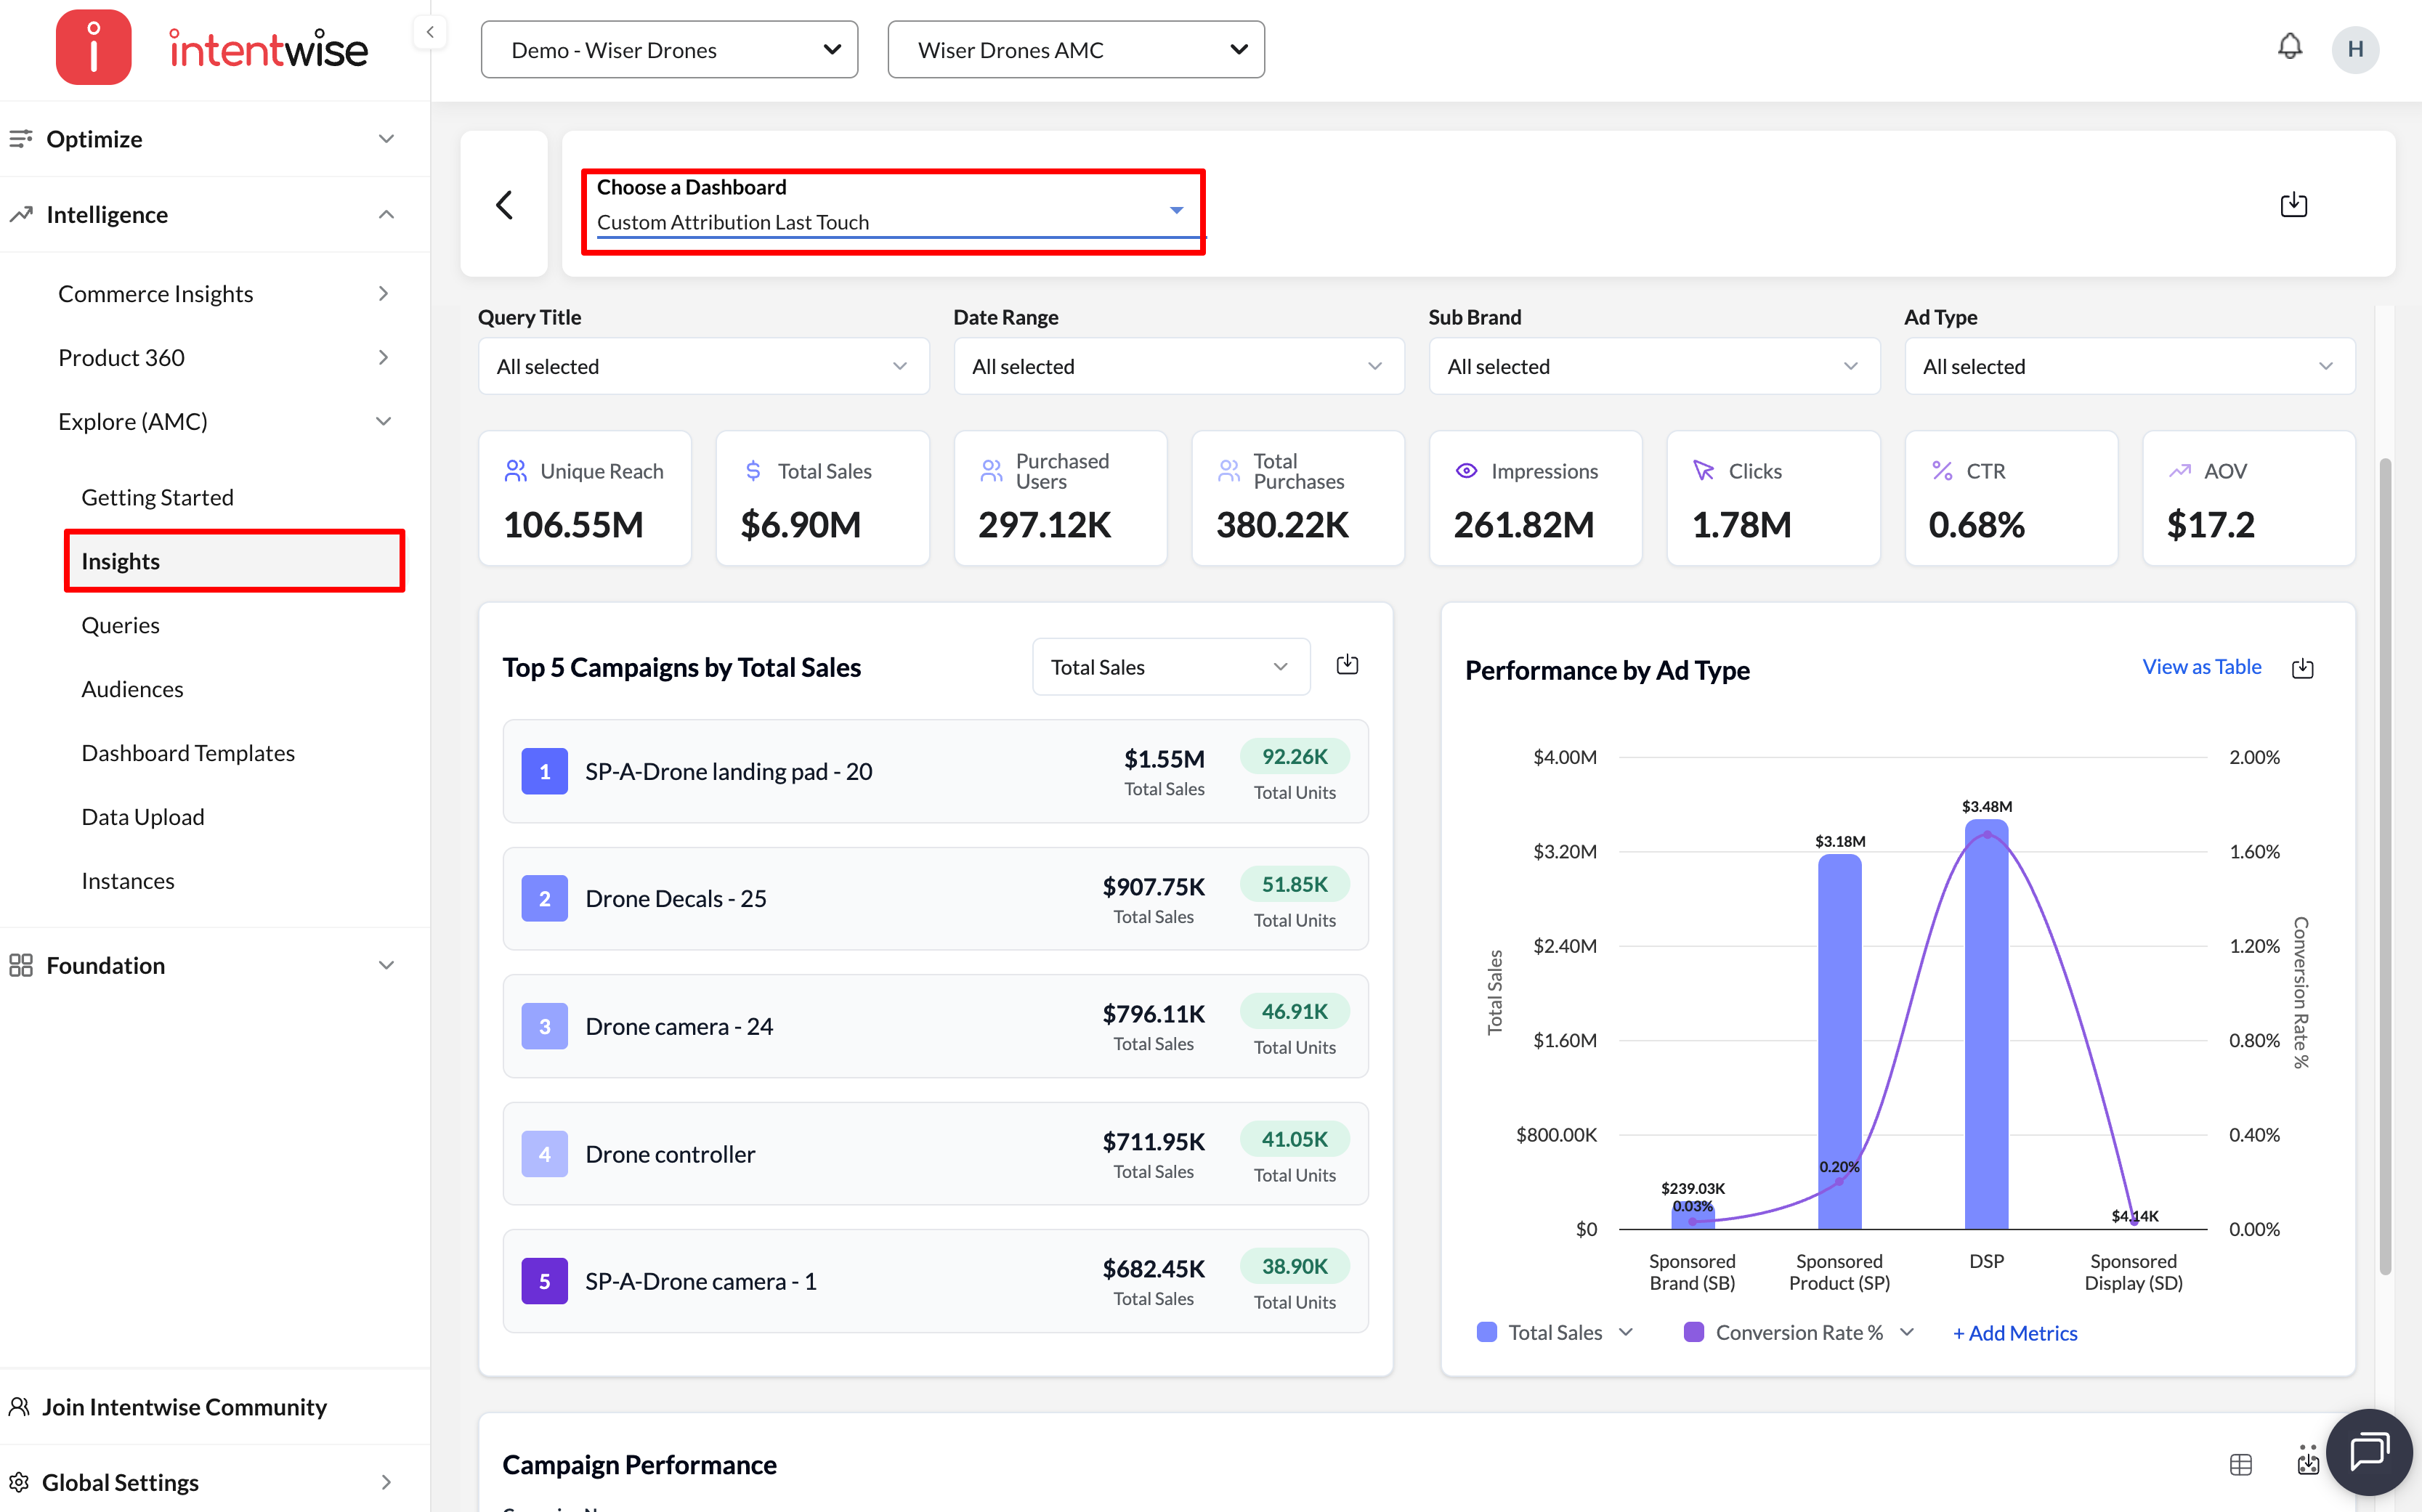
Custom Attribution Last Touch
Use the "Custom Attribution - Last Touch" instructional query in Amazon Marketing Cloud (AMC) to identify the final touchpoints before purchase and understand what drives conversions.
This query assigns full conversion credit to the final ad interaction that occurred before purchase. It helps marketers:
-
Identify the last campaign or channel that influenced a purchase
-
Evaluate the performance of lower-funnel strategies
-
Allocate spend more effectively based on closing impact
Dashboard Overview 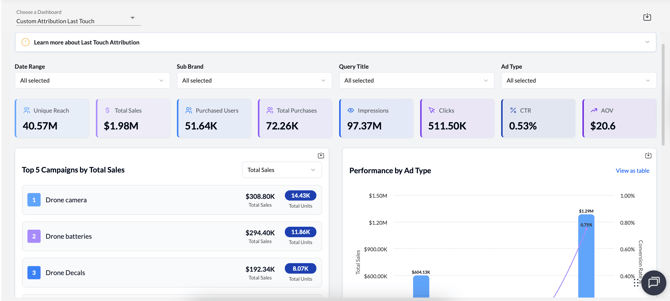
At the top of the dashboard, you see summary KPIs under the Last Touch attribution model:
-
Unique Reach (40.57M) – Distinct shoppers reached across campaigns.
-
Total Sales ($1.98M) – Revenue attributed to the final ad exposure before purchase.
-
Purchased Users (51.64K) – Unique users who converted.
-
Total Purchases (72.26K) – Number of purchase events tied to last-touch exposures.
-
Impressions (97.37M) – Total ad impressions served.
-
Clicks (511.50K) – Clicks on ads.
-
CTR (0.53%) – Click-through rate.
-
AOV ($20.6) – Average revenue per purchase.
This top section gives you a high-level view of campaign performance when measured by last-touch attribution.
Top 5 Campaigns by Total Sales 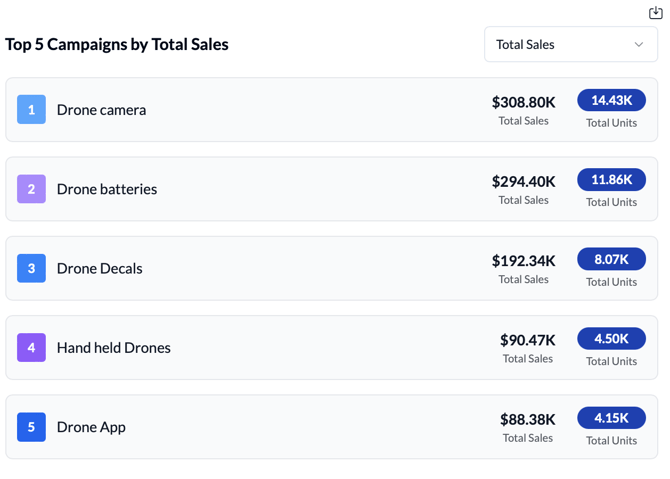
This section ranks the campaigns that closed the most sales under the Last Touch model.
-
Drone Camera led with $308.8K in sales and 14.4K units sold.
-
Drone Batteries followed with $294.4K in sales and 11.9K units sold.
-
Drone Decals contributed $192.3K across 8K units.
-
Handheld Drones generated $90.4K in sales.
-
Drone App added $88.3K.
This helps identify which campaigns acted as the final touchpoint most effectively.
Performance by Ad Type 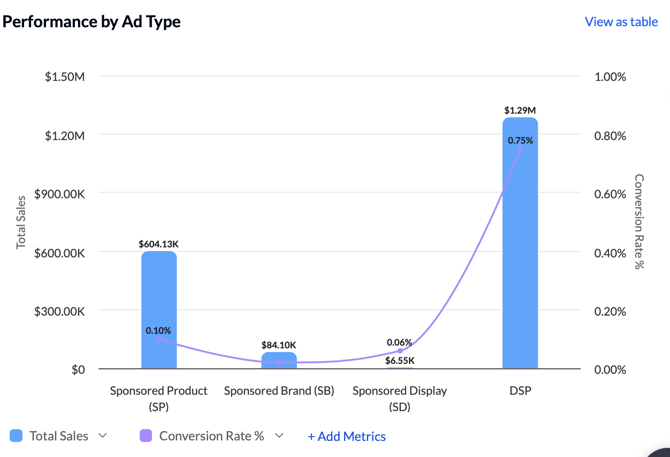
This visualization compares Total Sales and Conversion Rate across ad types.
-
DSP delivered the highest attributed sales ($1.29M) and the strongest conversion rate (0.75%).
-
Sponsored Products (SP) contributed $604.1K, but with a lower conversion rate (0.10%).
-
Sponsored Brands (SB) added $84.1K in sales at a modest conversion rate.
-
Sponsored Display (SD) was the smallest driver with $6.55K in sales and a 0.06% conversion rate.
This highlights which ad types perform best as last-touch “closers” in the funnel.
Campaign Performance Table
The table provides a granular breakdown of each campaign’s contribution under the Last Touch model.
For each campaign, you can see:
-
Unique Reach – Distinct shoppers reached.
-
Impressions – Number of times ads were served.
-
Clicks – Number of ad clicks.
-
Total Sales – Revenue attributed to the campaign as the final exposure.
-
Purchased Users – Unique converters.
-
Total Purchases – Number of purchase events.
-
AOV – Average revenue per purchase.
-
CTR – Click-through rate.
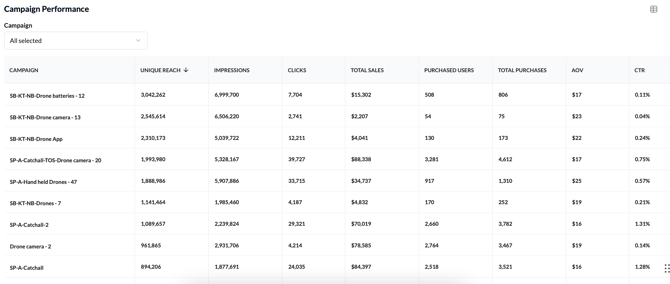
Example insights from the table:
-
SP-A Drone Camera (Catchall) generated $88.3K in sales with 3,281 converters.
-
SP-A Handheld Drones drove $34.7K with a strong CTR (0.57%).
-
SB Drone Batteries delivered $15.3K in sales with 508 converters, despite a modest CTR (0.11%).
This table allows you to drill down and compare performance across individual campaigns.
How It Works
-
Navigate to Intentwise Explore
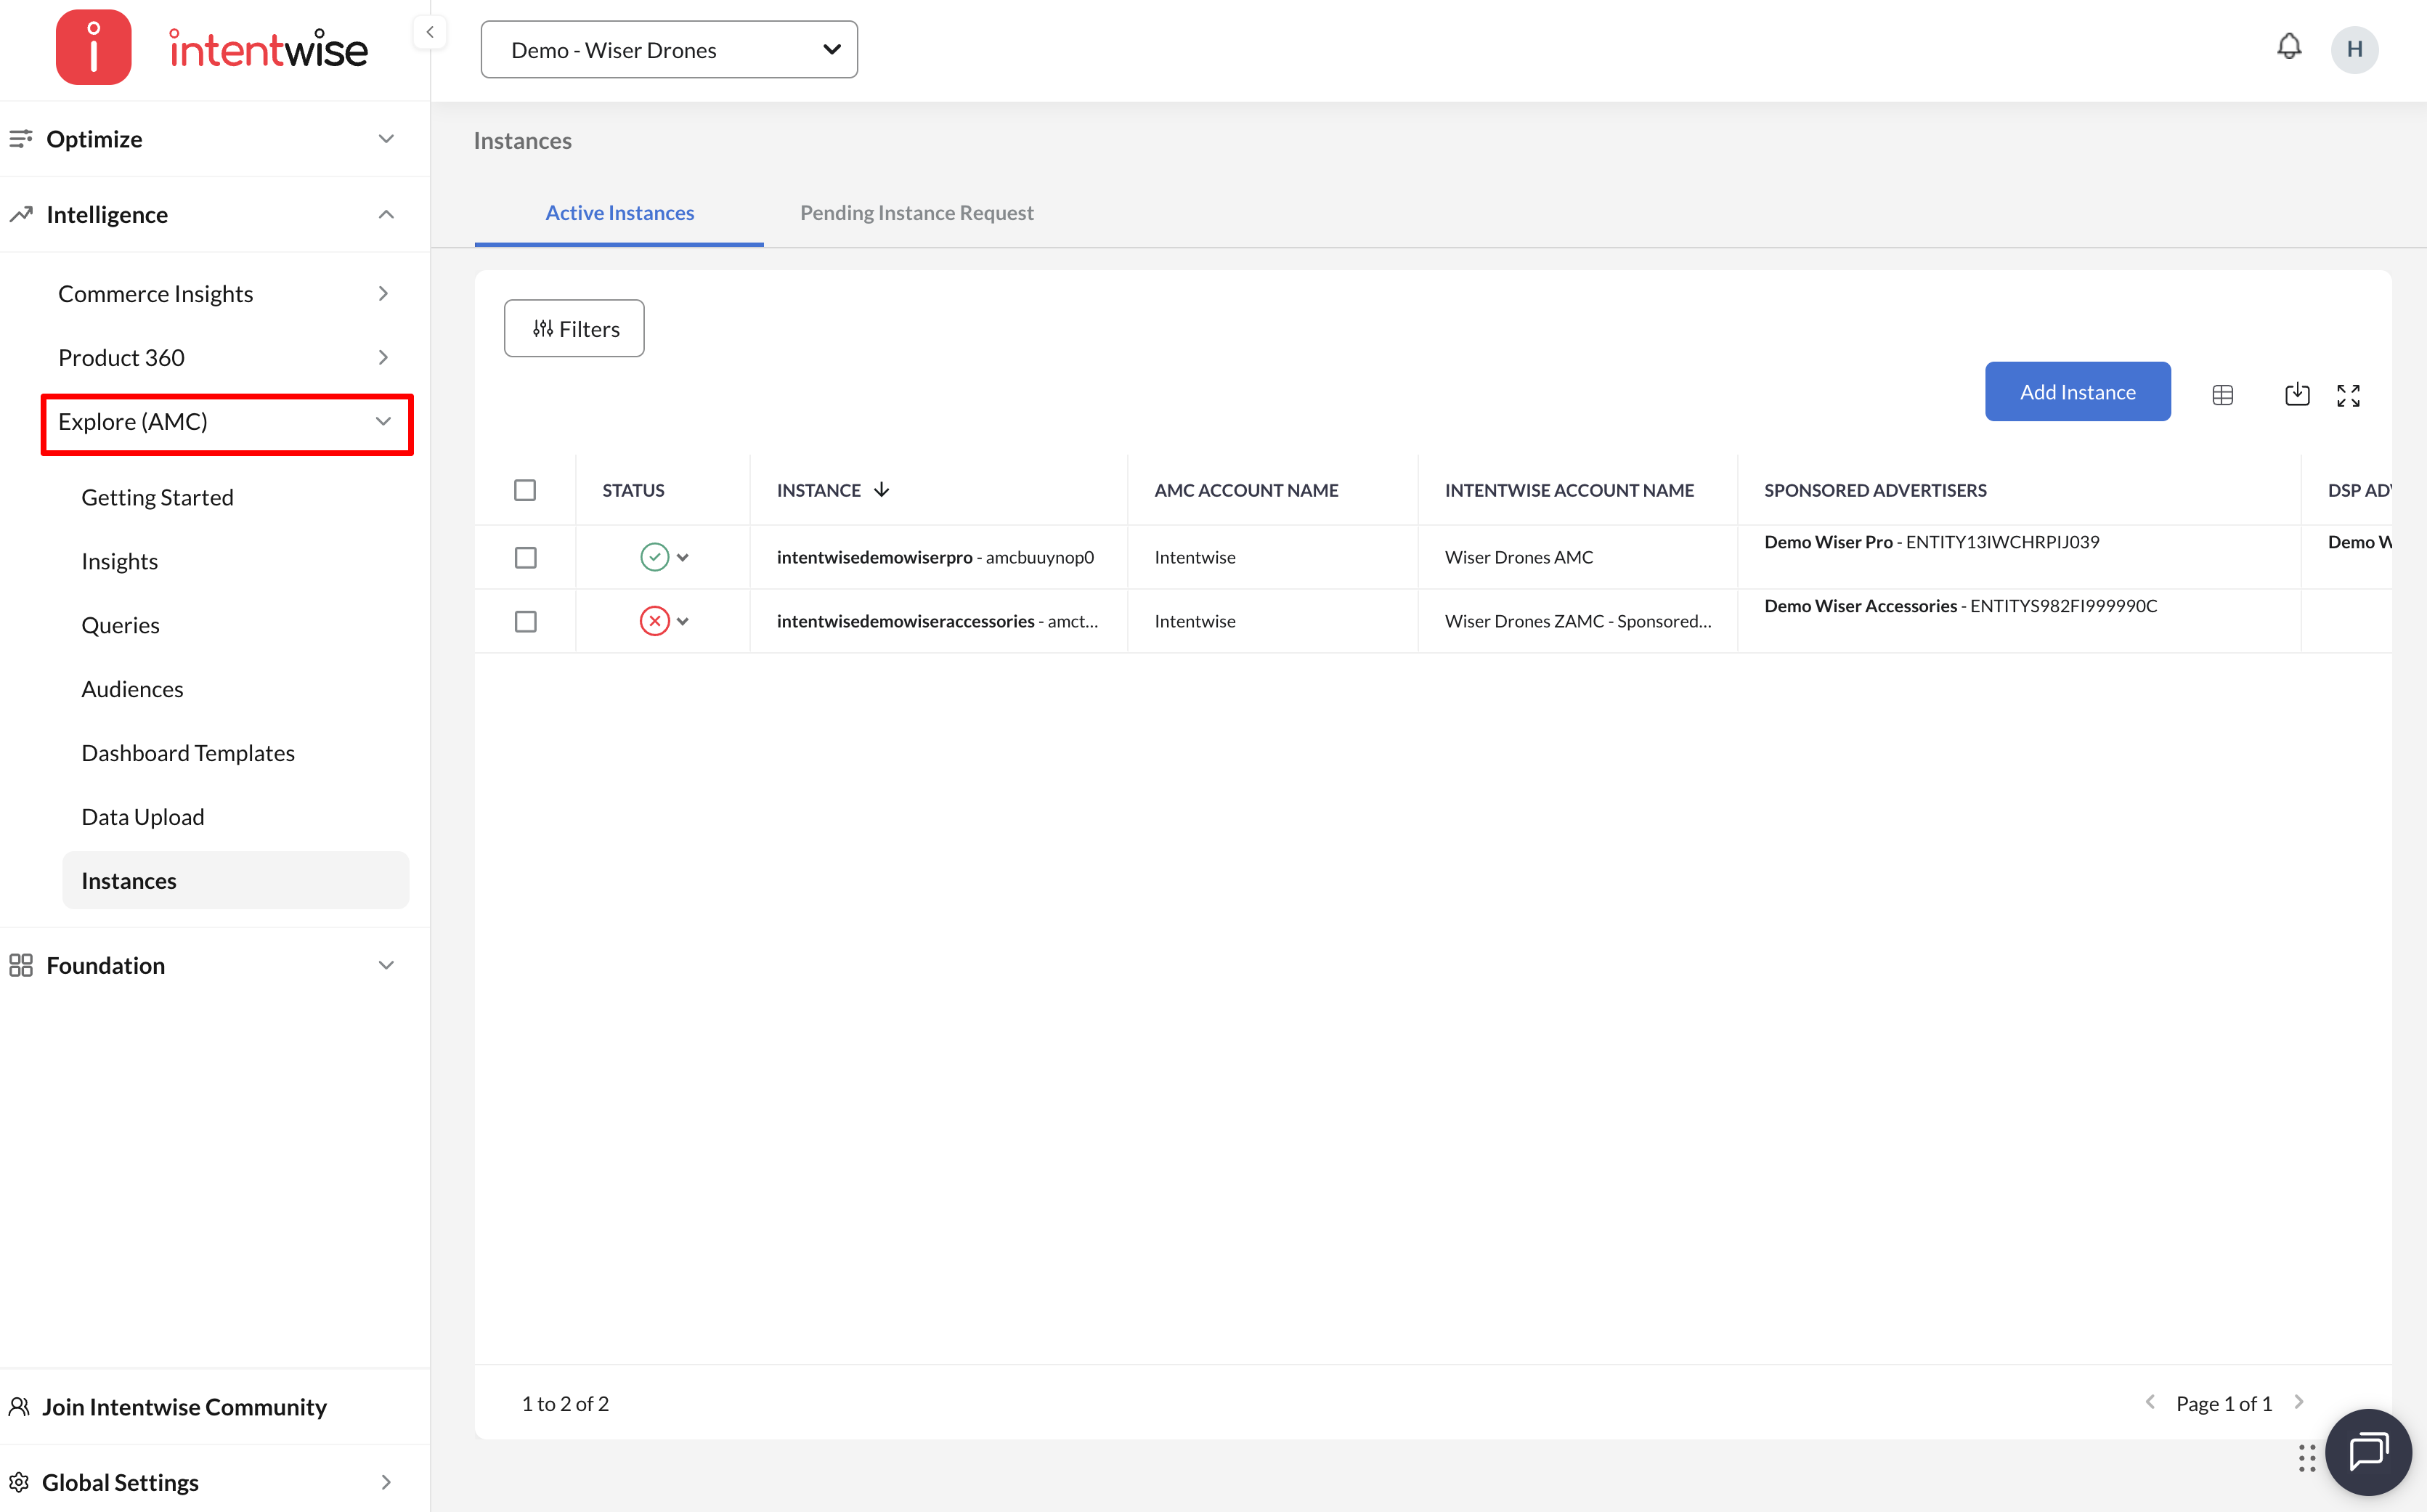
-
Go to Queries > Query Library
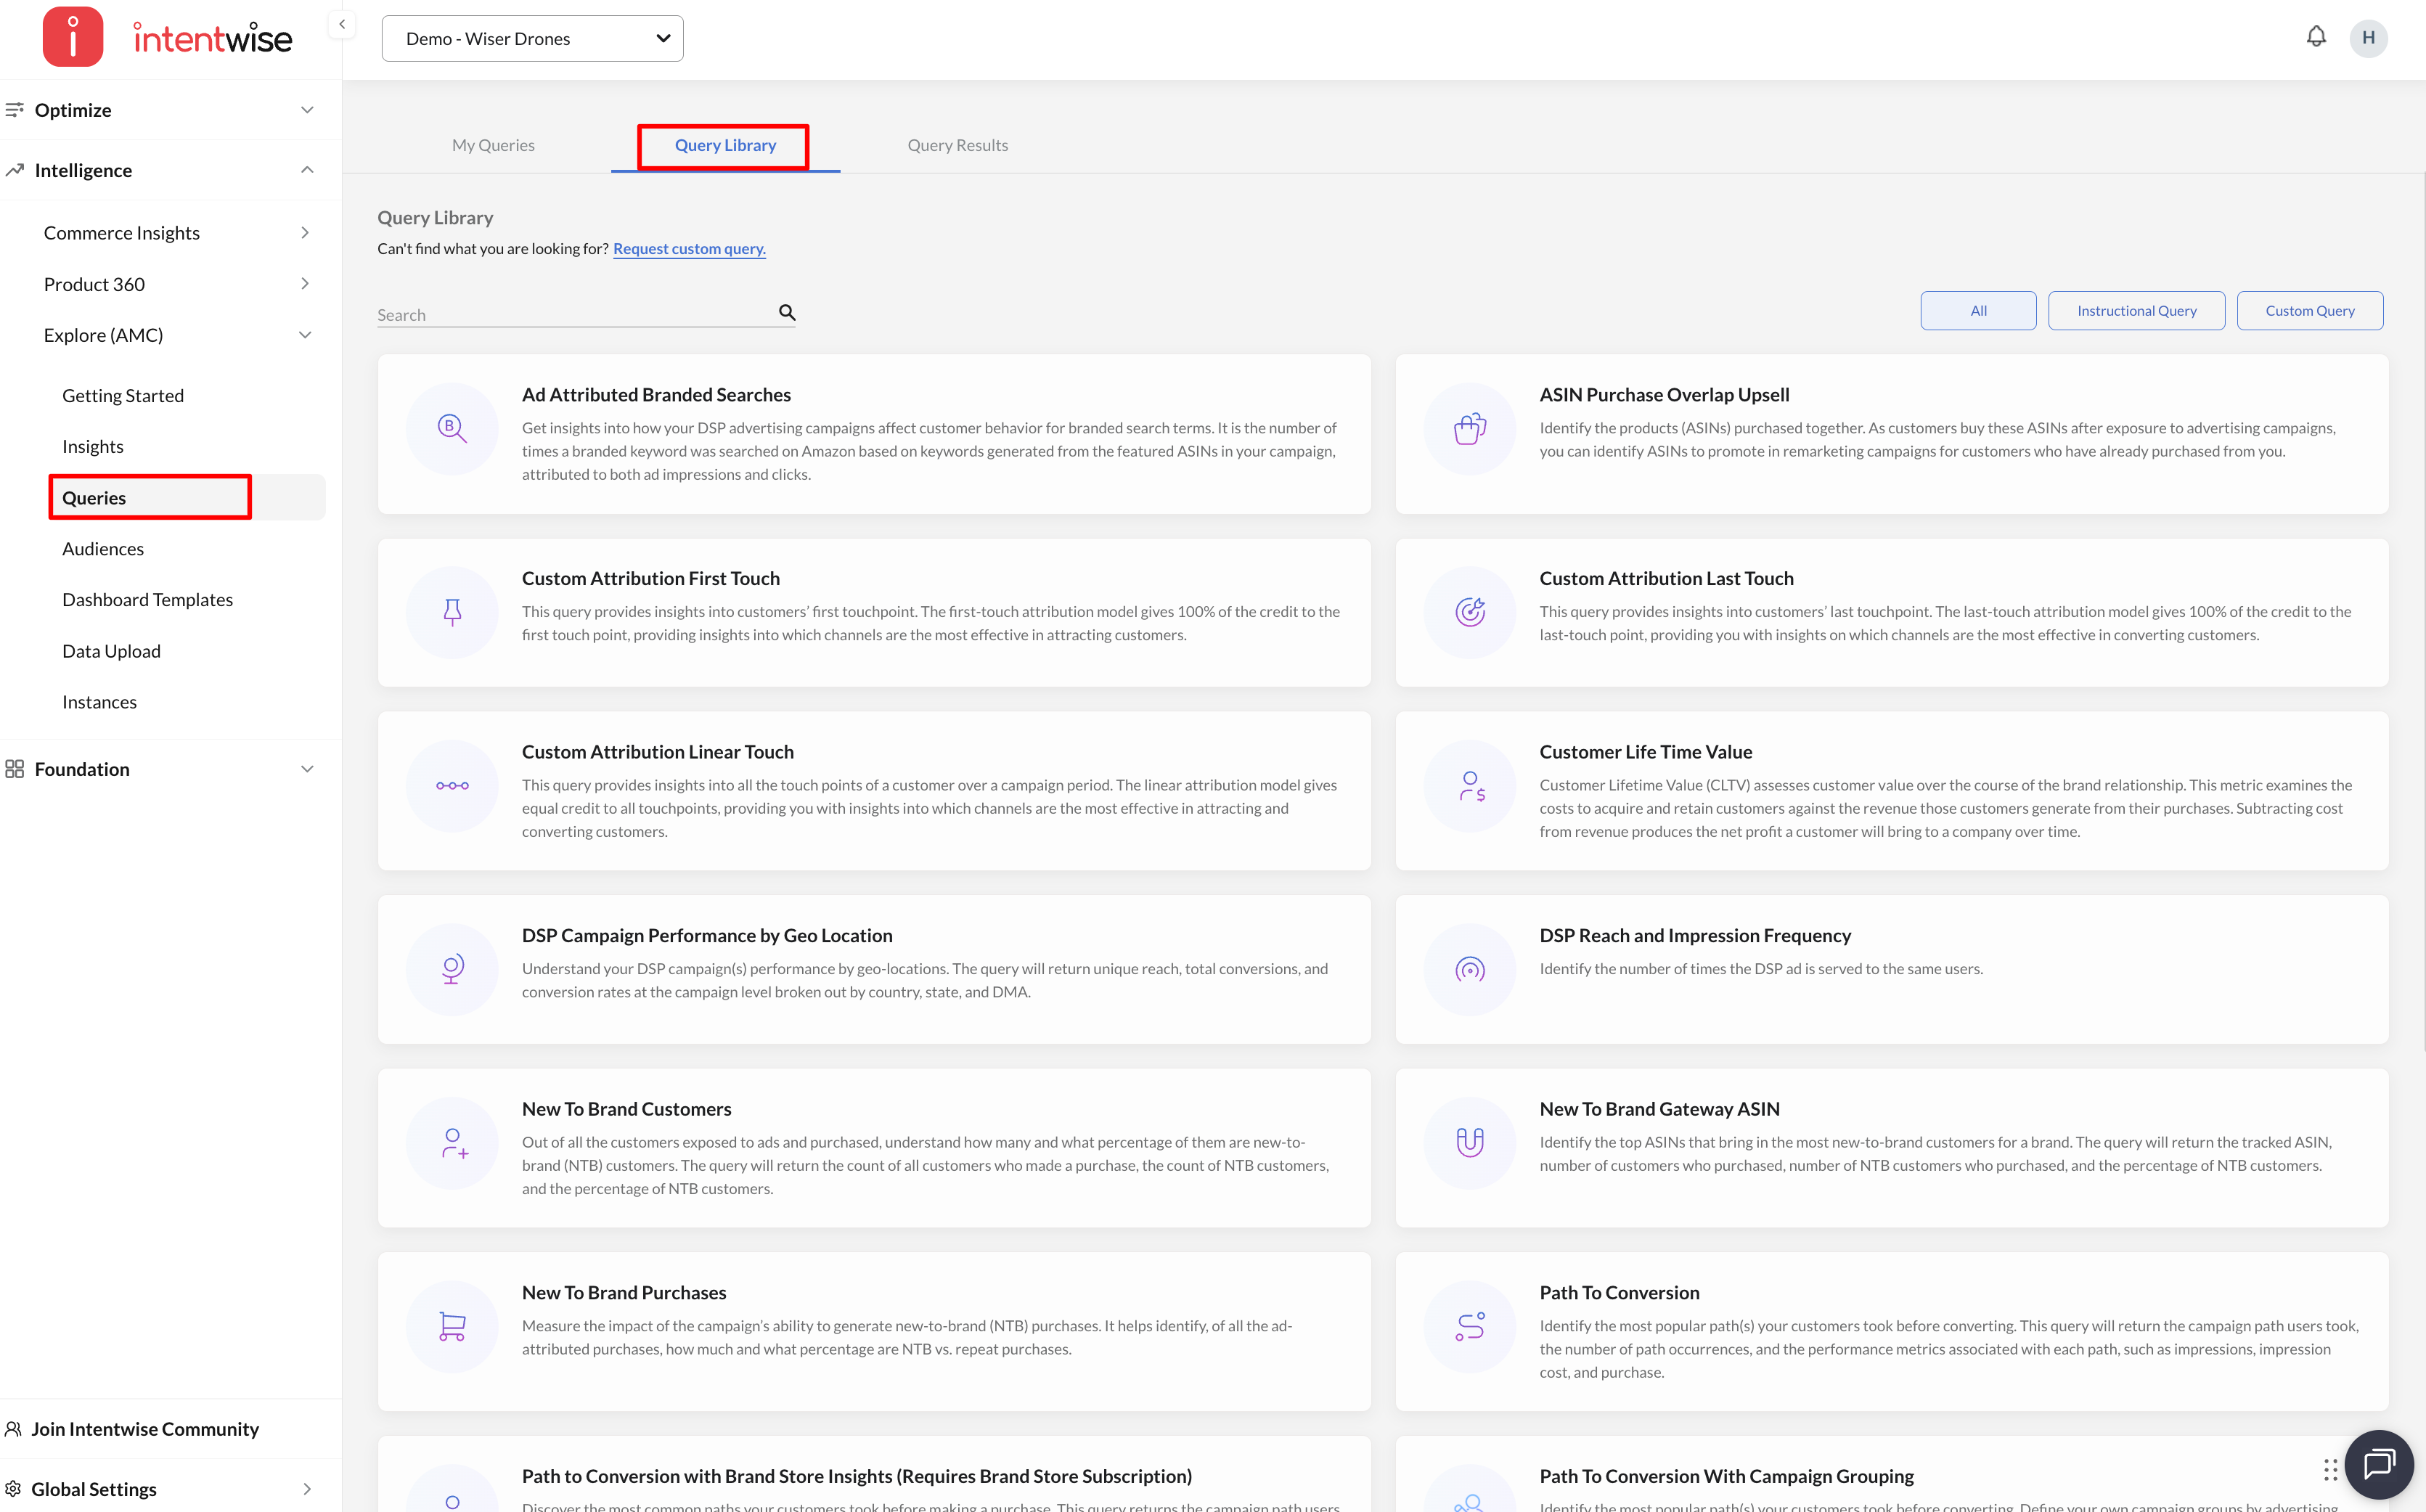
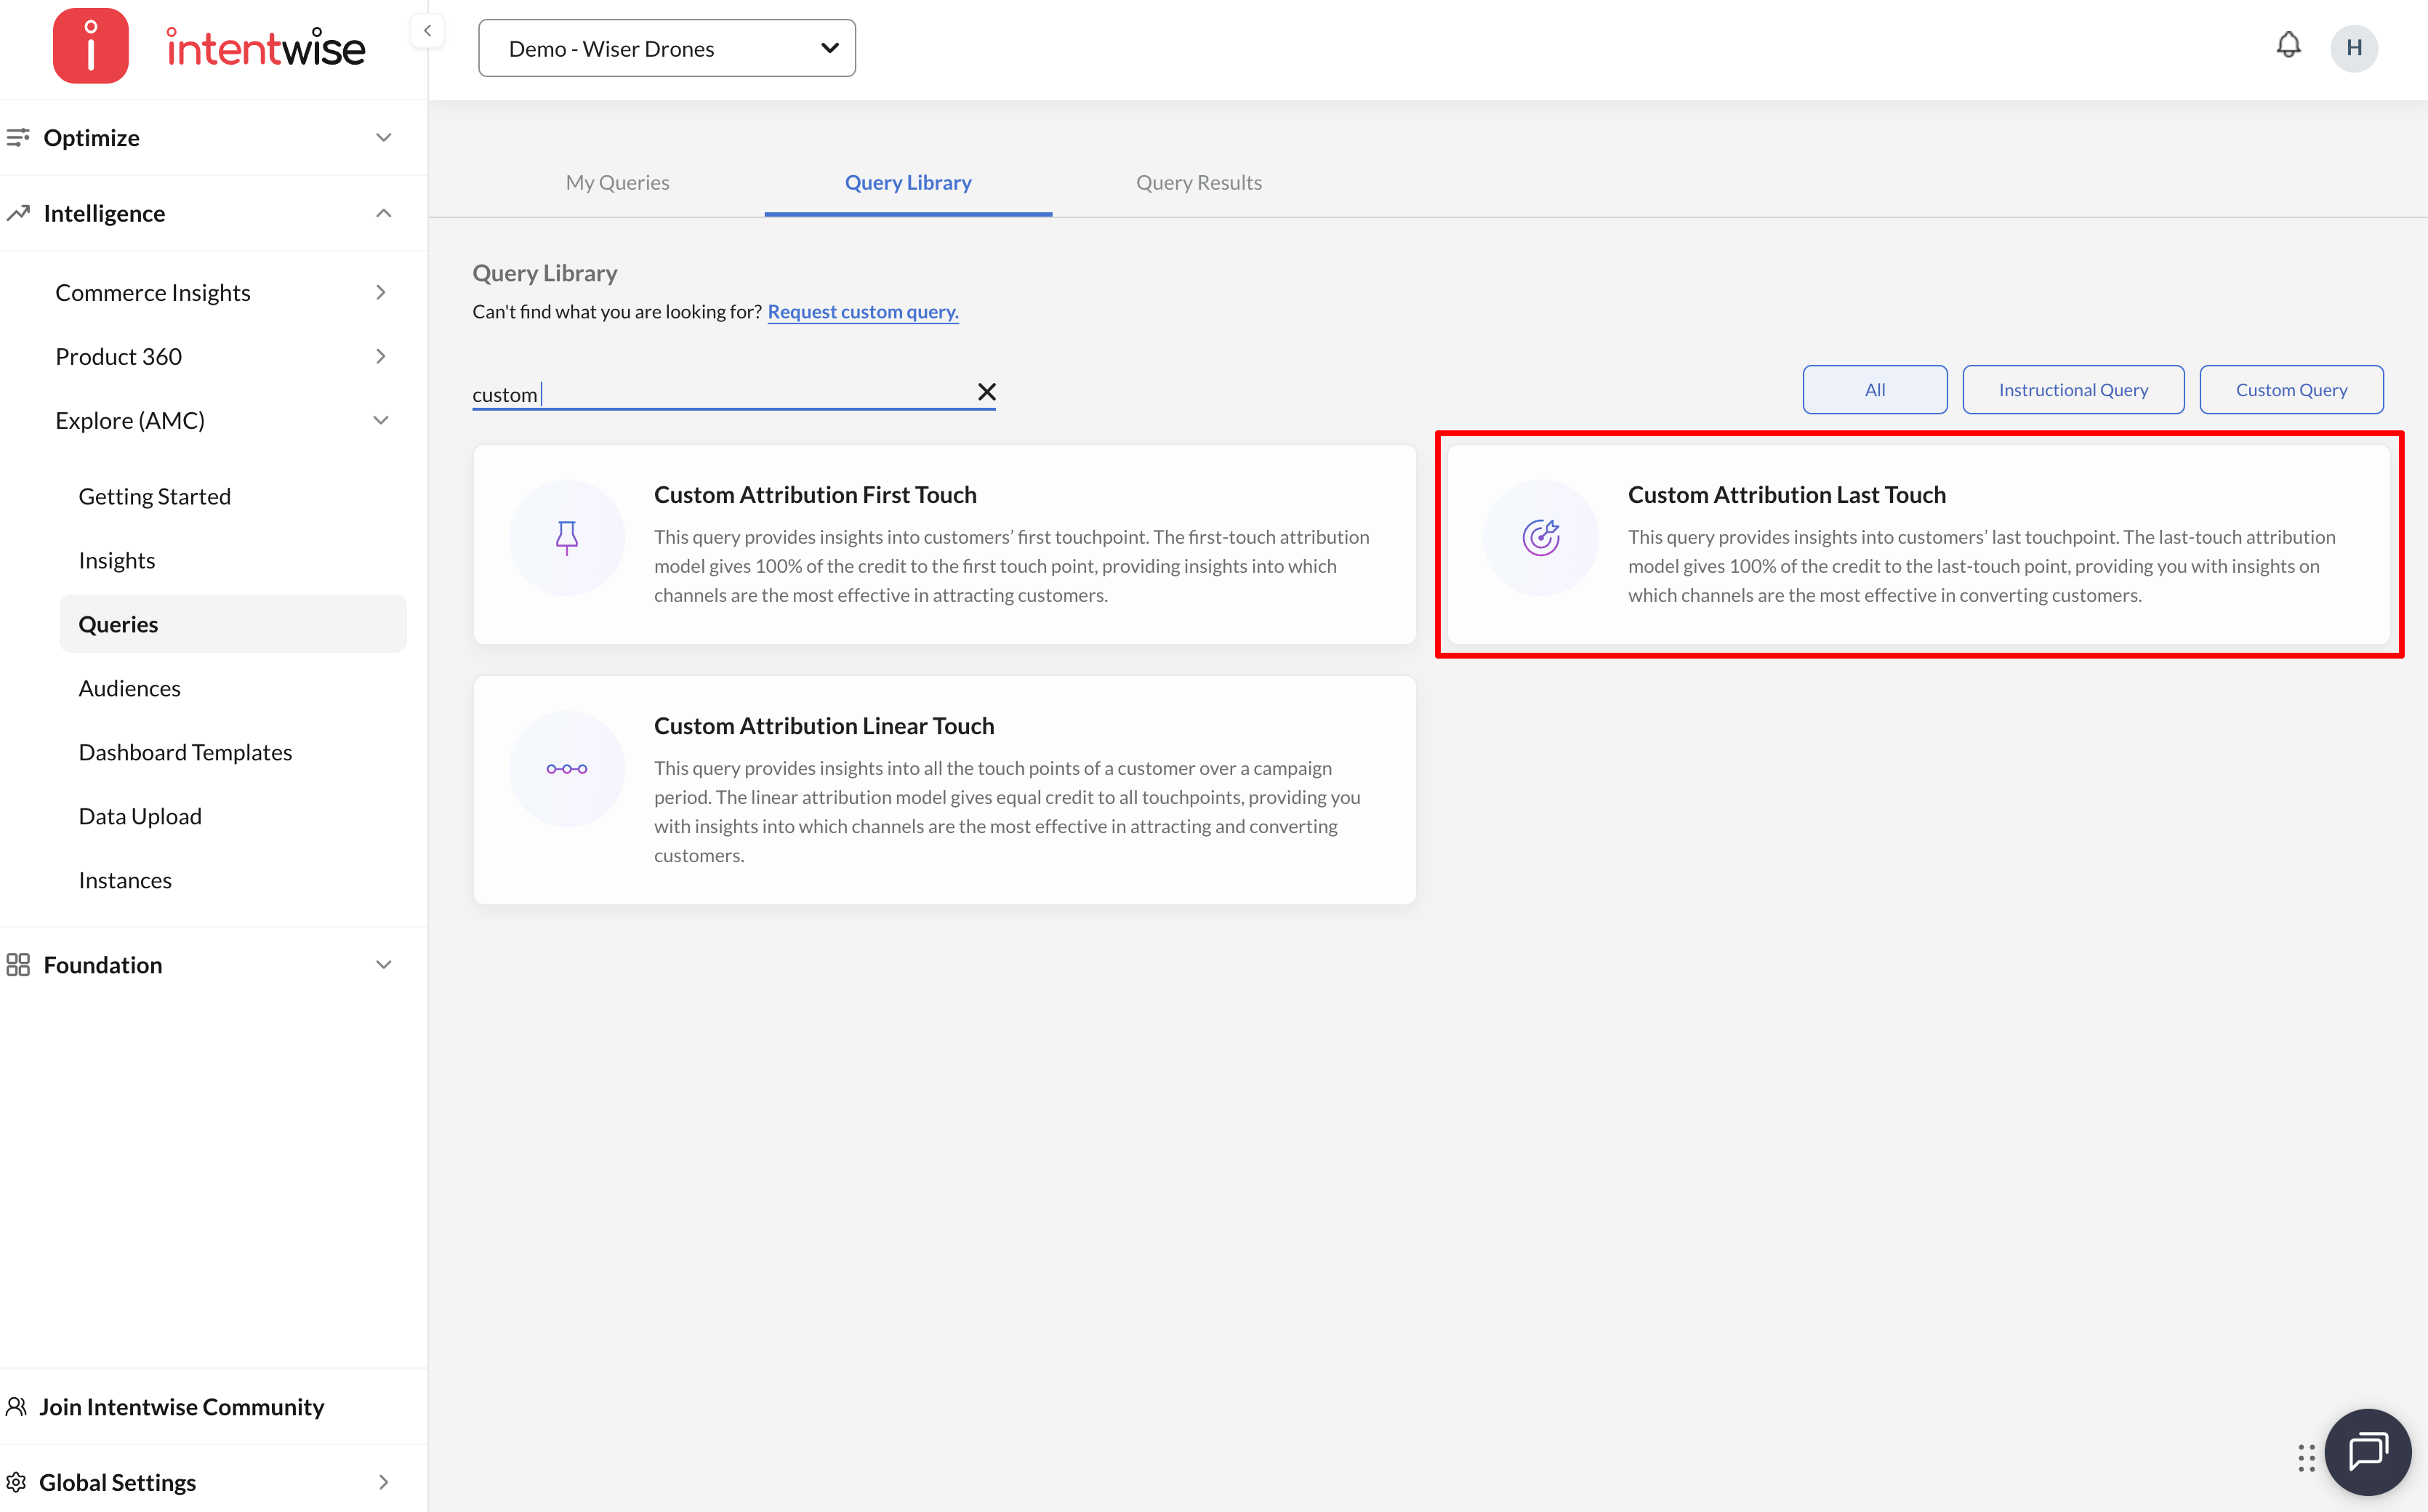
-
Search for and add "Custom Attribution - Last Touch" to your saved queries
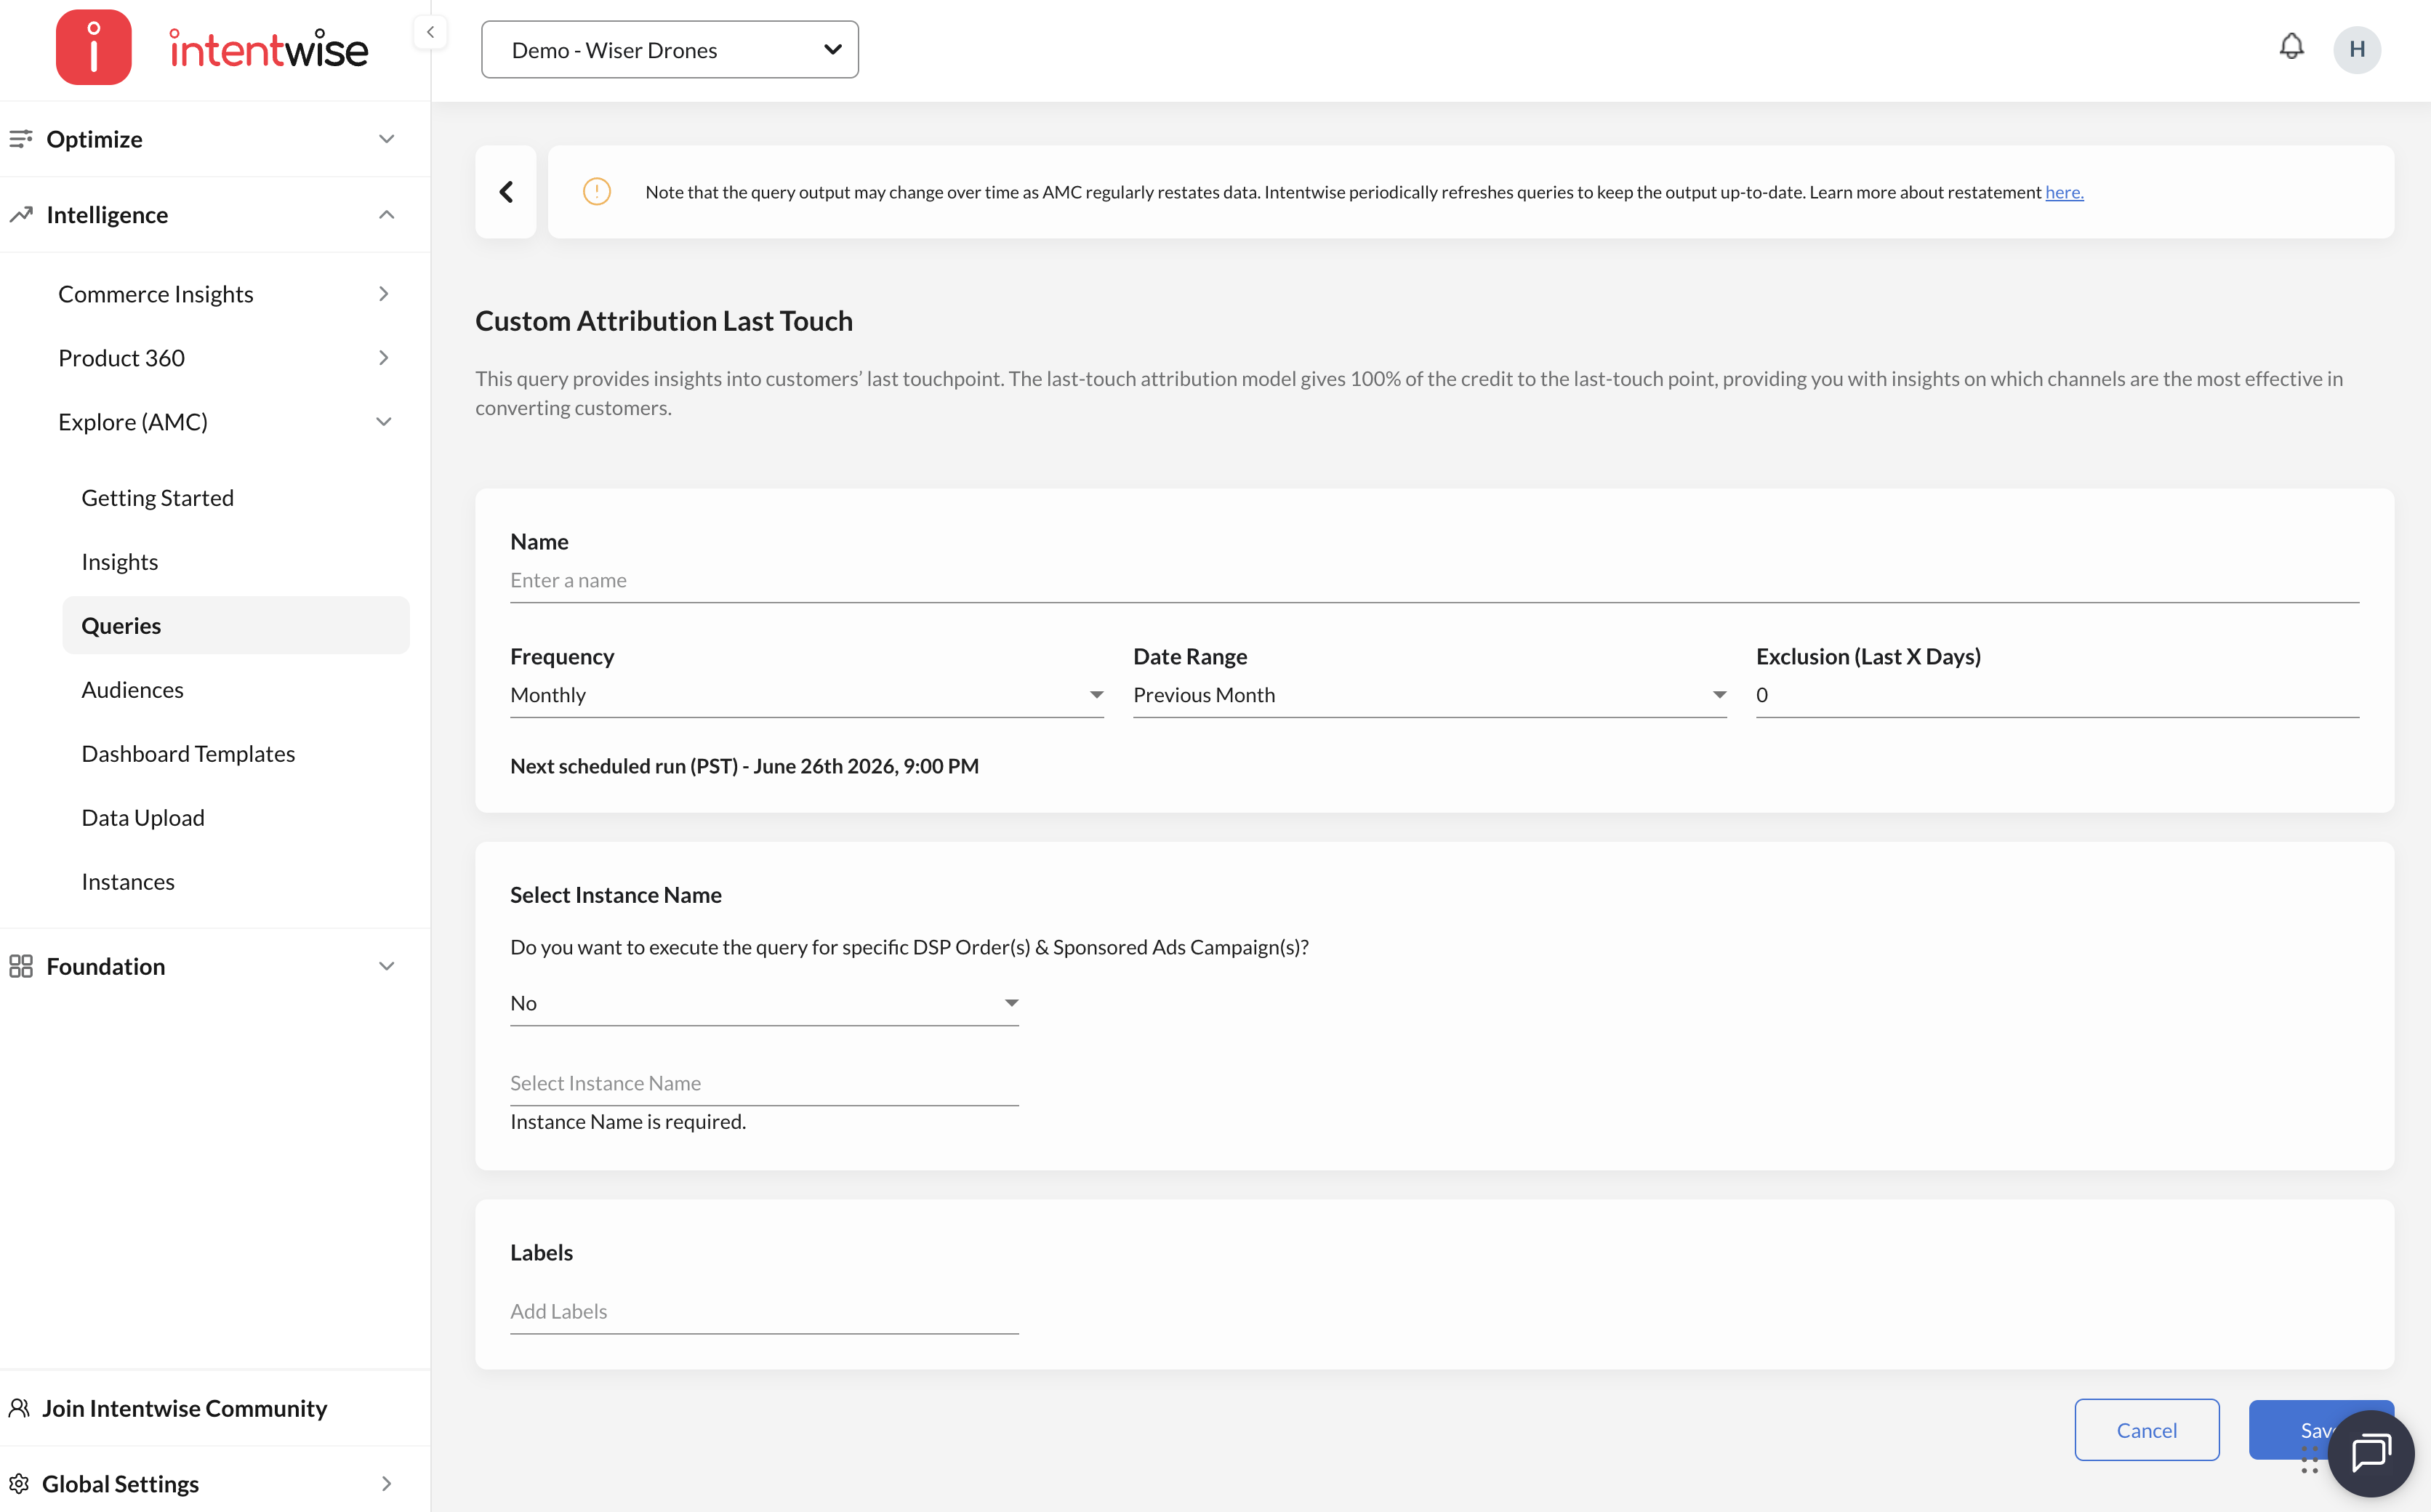
-
Fill in the required parameters and run the query (see this article for detailed settings)
-
Once executed, access the results under the Insights section for campaign-level metrics and visualizations.
For more information, refer to our data model.
Key Use Cases
-
End-of-Funnel Analysis: Identify which ads or channels are driving conversions
-
Budget Optimization: Shift investment toward the most impactful touchpoints
-
Performance Reporting: Attribute conversions to the most recent interactions
Tip: Use this alongside multi-touch attribution models to get a balanced view of influence across the funnel
Recommendations
-
Use in combination. Relying only on Last Touch may overvalue retargeting campaigns. Compare with multi-touch models for balance.
-
Spot “closer” campaigns. Campaigns that repeatedly show up as last-touch drivers may deserve more budget for bottom-funnel performance.
-
Evaluate ACOS and ROAS carefully. Last Touch can make ROAS look inflated for retargeting-heavy campaigns, so consider it as part of a bigger attribution picture.
-
Segment by ad type. Analyze how DSP, SP, SD, and SB each contribute as final touchpoints.
-
Use for tactical optimization. Last Touch is useful for campaign-level fine-tuning but should not be the only attribution model for strategic decisions.
Frequently Asked Questions (FAQs)
What are instructional queries?
Amazon Marketing Cloud's (AMC) instructional queries provide pre-written SQL code that AMC users can use as is or modify for common measurement and analytics tasks.
How is Last Touch different from First Touch attribution?
Last Touch credits the final ad exposure before purchase. First Touch credits the first ad exposure that introduced the shopper to the brand.