The DSP Reach and Impression Frequency
The DSP Reach & Impression Frequency Dashboard helps advertisers measure how effectively their DSP campaigns are reaching unique audiences and how often those audiences are being exposed to ads. By tracking unique reach, impressions, and average frequency, you can assess whether your campaigns are striking the right balance between reach and repetition.
This dashboard also ties exposure data back to outcomes like purchases, purchase rate, and spend efficiency, enabling smarter optimization decisions.
Dashboard Overview

Key Metrics at the Top
-
Unique Reach – Total number of unique users exposed to your ads.
-
Impressions – Total ad impressions served across campaigns.
-
Avg Frequency – Average number of times each unique user saw an ad.
-
Total Purchases – Purchases attributed to DSP campaigns.
-
Spend – Total DSP ad spend.
-
Purchase Rate – Purchases divided by impressions.
These KPIs quickly show if your ads are reaching enough new users and whether frequency is helping or hurting conversion.
Purchases vs. Purchase Rate by Frequency

This visualization shows how purchase outcomes vary depending on how often users were exposed to ads.
-
For example, users exposed 7–9 times may show higher purchase rates compared to those exposed 1–3 times.
-
This helps determine the “sweet spot” for effective frequency.
Purchases by Frequency Level

A breakdown of total purchases across buckets like:
-
Frequency Level 1–3
-
Frequency Level 4–6
-
Frequency Level 7–9
-
Frequency Level 10+
This donut chart highlights whether purchases are concentrated at low frequency (broad reach) or high frequency (repeated exposure).
Performance by Campaign

A campaign-level table showing:
-
Unique Reach
-
Impressions
-
Avg Frequency
-
Total Purchases
-
Spend
-
Purchase Rate
This lets you compare how different campaigns balance reach vs. frequency to drive conversions.
How it works
-
Navigate to Intentwise Explore
-
Go to Queries > Query Library
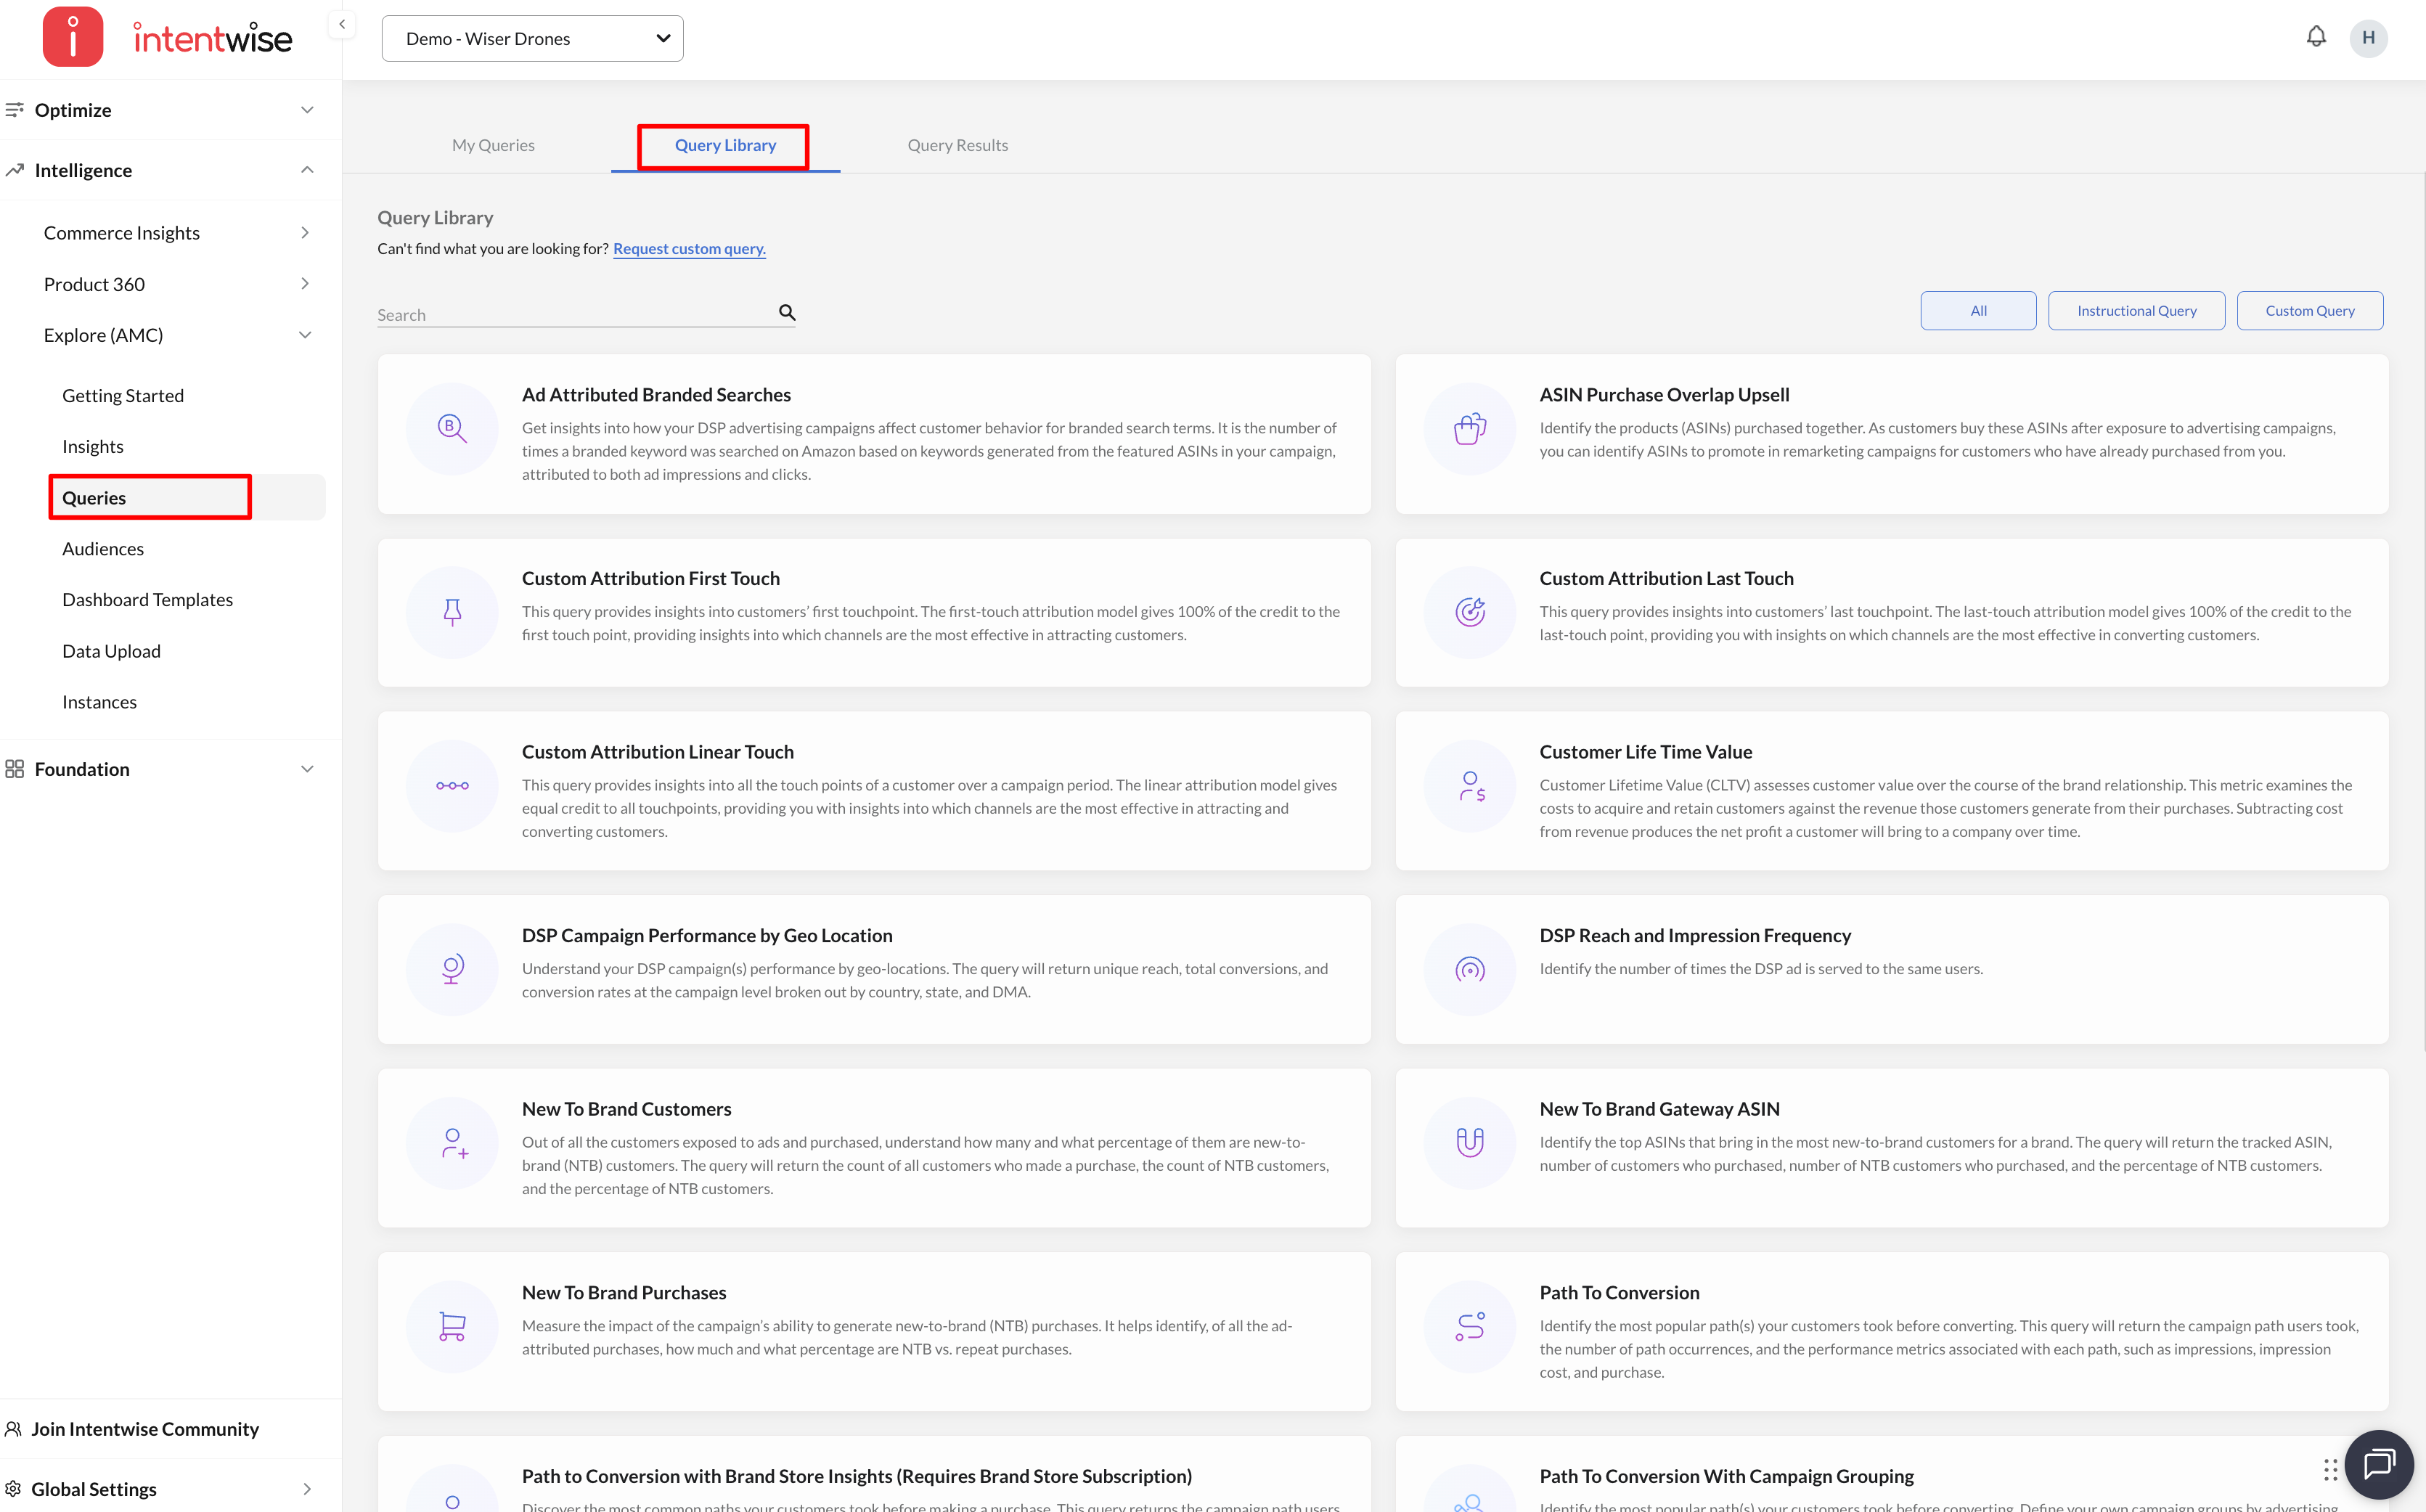
-
Search for and add "DSP Reach and Impression Frequency" to your saved queries

-
Fill in the required parameters and run the query (see this article for detailed settings)

-
Once executed, access the results under the Insights section for detailed metrics and visualizations.

For more information, refer to our data model.
Key Use Cases
-
Identify Effective Frequency – Discover the exposure range (e.g., 4–6 views) that maximizes conversions without overspending.
-
Optimize Budget Allocation – Shift spend to campaigns that achieve stronger purchase rates at optimal frequency.
-
Detect Ad Fatigue – High frequency with low purchase rate signals wasted impressions and audience fatigue.
-
Balance Reach vs. Retargeting – Compare broad awareness campaigns vs. retargeting campaigns with higher frequency.
Frequently Asked Questions (FAQs)
What are instructional queries?
Amazon Marketing Cloud's (AMC) instructional queries provide pre-written SQL code that AMC users can use as is or modify for common measurement and analytics tasks.