Sponsored Ads and DSP Overlap
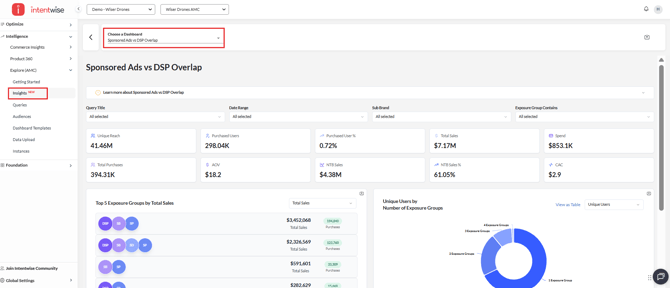
The Sponsored Ads vs. DSP Overlap dashboard helps you understand how different ad types on Amazon [DSP, Sponsored Products (SP), Sponsored Brands (SB), and Sponsored Display (SD)] interact to drive sales. It provides both a high-level overview and detailed breakdowns of how shoppers exposed to one or more channels behave, so you can measure cross-channel effectiveness.
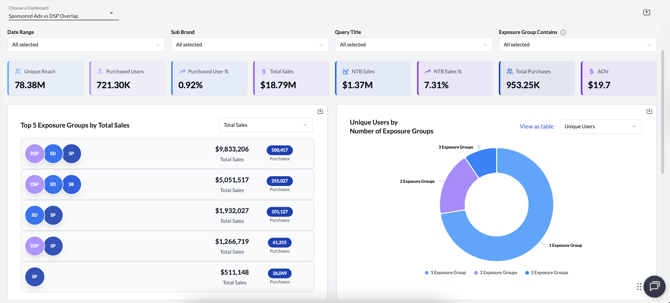
Dashboard Overview
At the top of the dashboard, you’ll find key performance metrics such as:
-
Unique Reach – Distinct shoppers reached across all exposure groups.
-
Purchased Users – Number of unique users who completed a purchase.
-
Purchased User % – Share of reached users who converted.
-
Total Sales – Revenue generated from all exposure groups.
-
NTB Sales – Sales revenue from new-to-brand customers.
-
NTB Sales % – Share of sales attributed to new-to-brand buyers.
-
Total Purchases – Total number of purchases completed.
-
AOV (Average Order Value) – Average revenue per purchase.
This overview helps you quickly understand how overlap between ad types influences both reach and revenue.
Top 5 Exposure Groups by Total Sales
The dashboard shows the Top 5 Exposure Groups by Total Sales, breaking down which combinations of ad types are most effective.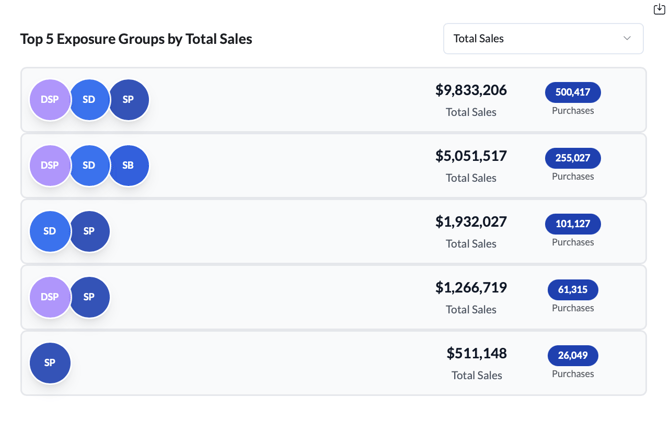
For example:
-
Shoppers exposed to both DSP + SP + SD generated $9.8M in sales across 500K purchases.
-
Users reached through DSP + SP + SB delivered over $5.0M in sales.
-
Single-channel SP exposure contributed $511K, highlighting the incremental lift from multi-channel overlaps.
This makes it easy to see how different combinations of ads work together to drive conversions.
Unique Users by Number of Exposure Groups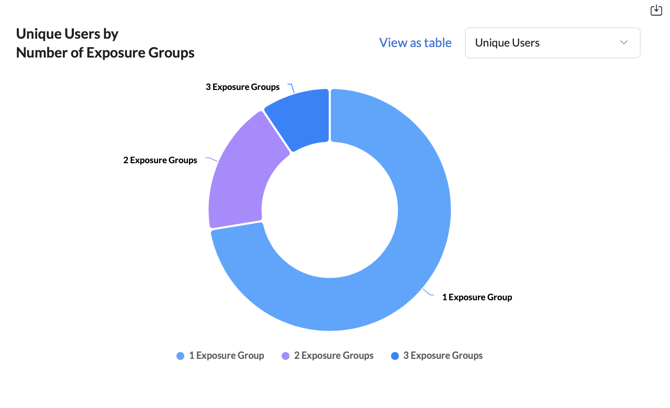
The donut chart segments users by the number of channels they were exposed to:
-
1 Exposure Group – Shoppers who only saw one ad type.
-
2 Exposure Groups – Shoppers who saw a combination of two ad types.
-
3 Exposure Groups – Shoppers who engaged with all three ad types.
This visualization helps you identify how multi-channel exposure impacts engagement and purchase likelihood.
Detailed Metrics by Exposure Group
The Detailed Metrics by Exposure Group table provides a granular view, including:
-
Unique Reach
-
Impressions
-
CTR
-
Purchased Users
-
Total Purchases
-
AOV
-
Total Sales
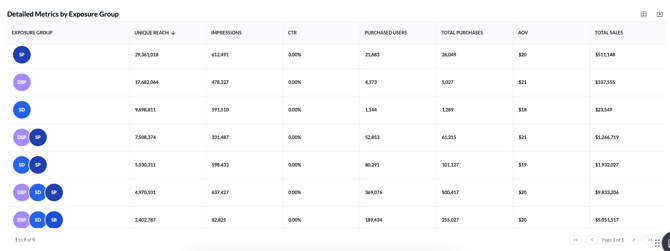
For example:
-
DSP + SP exposure delivered $1.26M in sales from 61K purchases at an AOV of $21.
-
SD + SP exposure contributed $1.93M in sales, with 80K unique buyers.
-
Single SP exposure generated $511K, showing the relative value of overlap.
This table is particularly useful for advertisers who want to compare the effectiveness of single-channel versus multi-channel strategies.
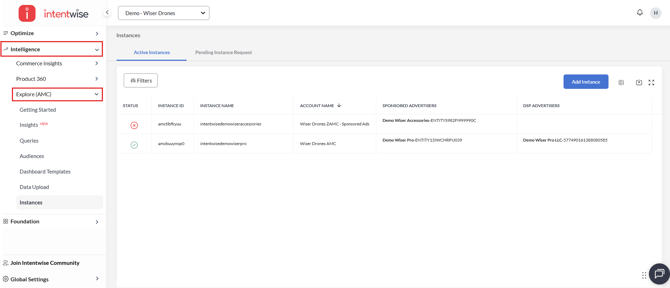
How it works
-
Navigate to Intelligence -> Explore(AMC)
-
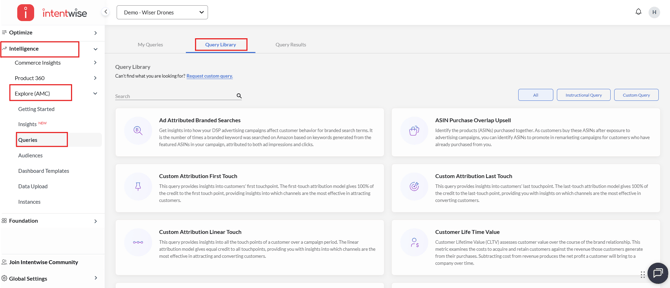
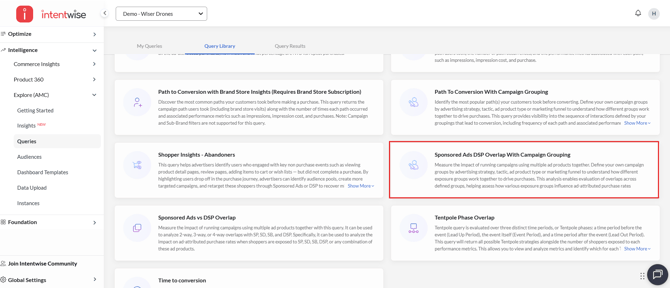
Go to Queries > Query Library
-
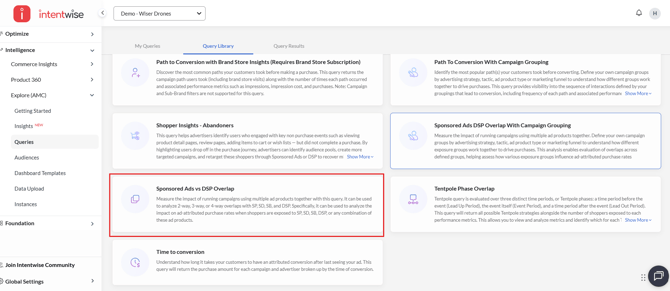
Search for and add "Sponsored Ads and DSP Overlap" to your saved queries
-
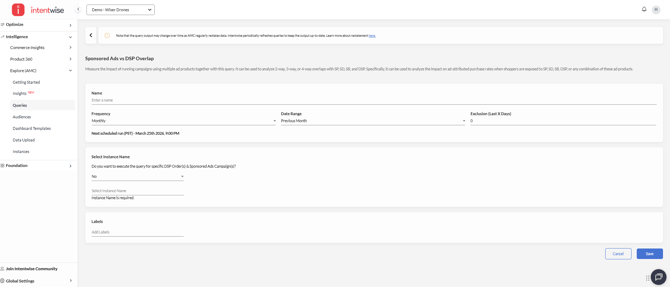
Fill in the required parameters and run the query (refer to this article for detailed settings)
-
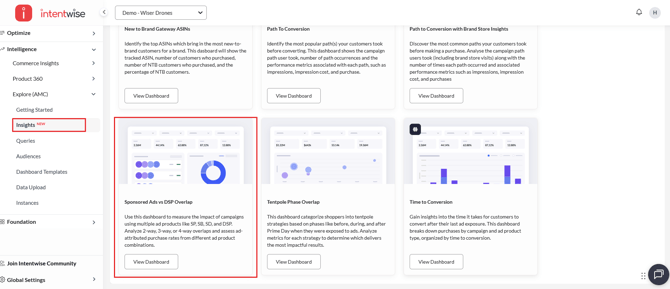
Once executed, access the results under the Insights section for product-level metrics and visualizations.
For more information, refer to our data model.
Sponsored Ads and DSP Overlap With Campaign Grouping
Evaluate the impact of campaigns across multiple ad products. By creating custom campaign groups based on strategy, tactics, ad product type, or funnel stage, you can gain a clearer understanding of how different exposure groups interact to drive purchases.
This analysis highlights overlaps between defined groups, allowing you to assess how various exposure groups influence ad-attributed purchase rates and overall performance.
How it works
-
Navigate to Intelligence -> Explore(AMC)
-
Go to Queries > Query Library
-
Search for and add "Sponsored Ads DSP Overlap With Campaign Grouping" to your saved queries
-
Fill in the required parameters (refer to this article for detailed guidance)
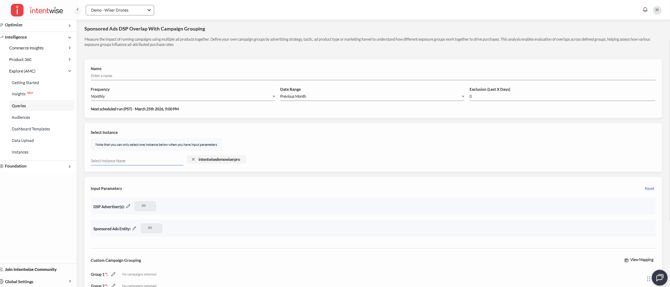
Note: You can only select one instance per query setting
-
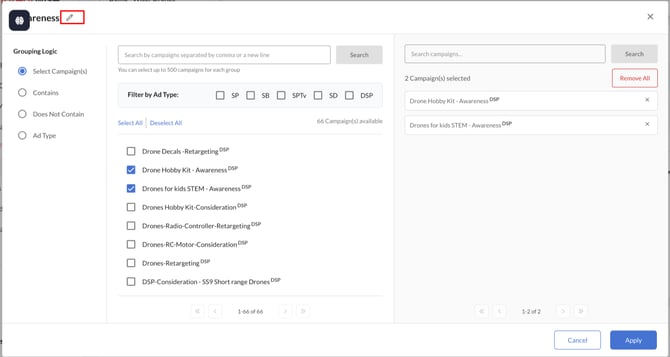
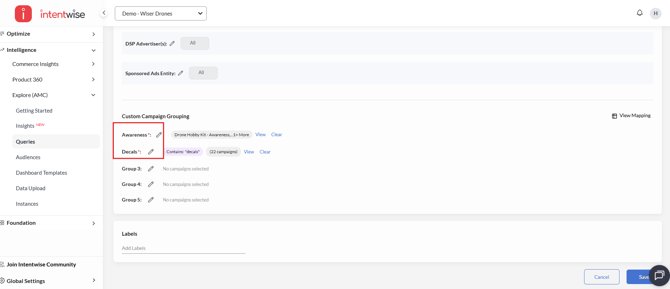
Campaign Group Configuration
-
You can define up to 5 custom campaign groups
-
A minimum of 2 groups is required, while the remaining are optional
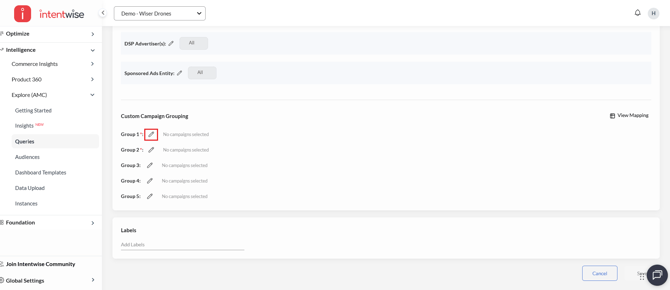
- Campaign groups can be renamed to align with your naming conventions for better clarity and organization
-
-
Grouping Options
You can define campaign groups using one of the following methods:
-
Select Campaign (Static)
Choose specific campaigns using filter conditions. The selected campaigns remain fixed and do not change over time. This method allows you to select up to 500 campaigns.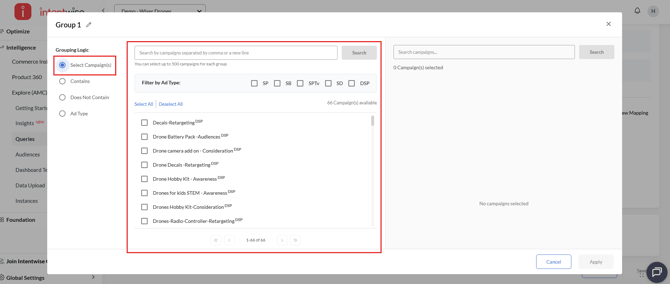
-
Contains (Dynamic)
Enter one or more strings (each on a new line) to match campaign names containing those values.
Multiple entries are treated as OR conditions (e.g., string1 OR string2).
Campaigns are dynamically identified at runtime, so newly created campaigns matching the criteria will be included automatically.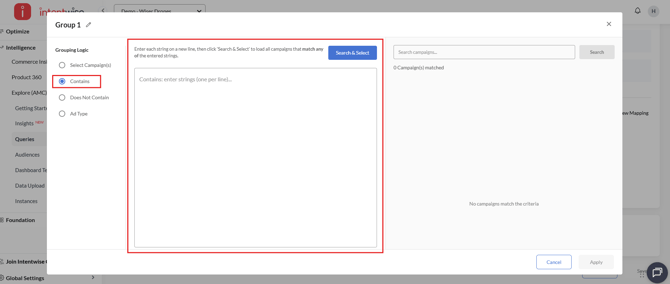
-
Does Not Contain (Dynamic)
Define strings to exclude campaigns containing those values.
Campaigns are dynamically evaluated when the query runs, ensuring new campaigns are included if they meet the criteria.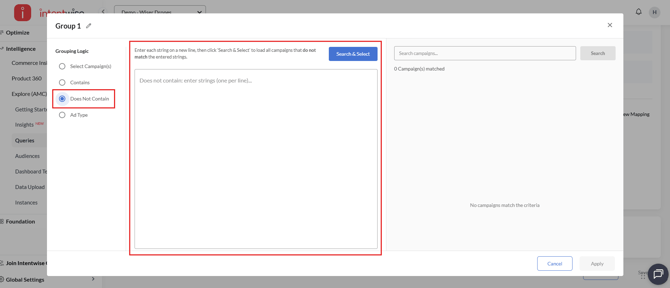
-
Ad Type (Dynamic)
Select one or more ad types. Campaigns are dynamically included based on the selected ad types during query execution.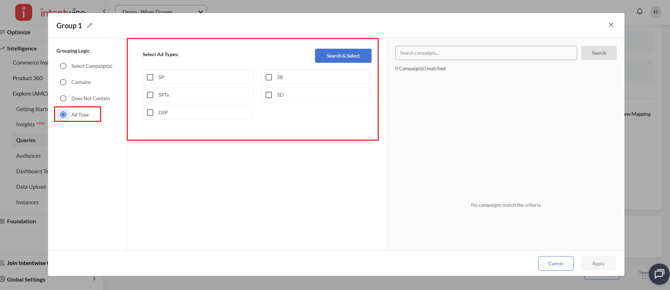
-
- Once all required parameters are configured and the query is executed, results can be accessed in the Insights section for product-level metrics and visualizations within the same Sponsored Ads and DSP Overlap dashboard.
Key Use Cases
-
Measure synergy between channels – Identify how DSP and Sponsored Ads reinforce each other in driving purchases.
-
Understand incremental value – Compare single-channel exposures vs. multi-channel exposures to assess overlap benefits.
-
Budget allocation – Direct more spend toward combinations that drive higher total sales and stronger NTB percentages.
-
Audience strategy – Optimize targeting by identifying which exposure mixes deliver the highest purchase rates.
-
Creative optimization – Test whether multi-channel exposure (e.g., DSP + SP) increases conversion likelihood compared to single exposure.
Recommendations
-
Leverage multi-channel overlap. Users exposed to multiple ad types (e.g., DSP + SP) typically generate higher sales and purchase volumes than single-channel exposures.
-
Use overlap insights to guide budgets. If overlap groups consistently drive most of the sales, allocate budget strategically across channels to maximize synergy.
-
Check incremental lift. Compare single-channel exposure (e.g., only SP) against overlaps (e.g., DSP + SP) to measure the true incremental impact of DSP.
-
Balance efficiency and scale. Some single-exposure groups may have higher AOV or conversion efficiency, while overlaps drive scale.
-
Track NTB Sales % at the top-level KPIs. While not broken down by exposure group, NTB metrics in the header give you a sense of how much of your overall sales are coming from new-to-brand users.
Frequently Asked Questions (FAQs)
What are instructional queries?
Amazon Marketing Cloud's (AMC) instructional queries provide pre-written SQL code that AMC users can use as is or modify for common measurement and analytics tasks.
What does “exposure group” mean?
An exposure group is a segment of users who were shown ads from one or more Amazon ad types (DSP, SP, SD, SB).
Is overlap always better than single exposure?
Not always. While overlap often increases purchases, some single-channel exposures may still show higher ROAS. The overlap dashboard helps balance efficiency vs. scale.